TIL: eBPF is awesome
Debugging Linux PerformanceI was doing some research at work for tracing and observability for microservices, when I came across Pixielabs. This tool advertises that you can instantly troubleshoot applications without any instrumentation or special code inside the apps, which sounded ✨magical✨ to me. So naturally I wanted to know a little more about what enables this technology to work, and after scrolling through the site, under the “No Instrumentation” section was this acronym eBPF.
After some further digging on the internet, reading the design papers and watching several videos, it was safe to say this technology caught my attention, so I wanted to write some notes on it and I hope this post will spark some further interest in you as well.
So what is eBPF exactly?
The TL;DR version is that this technology enables sandboxed user applications to run in the Linux kernel itself. In a way it makes the kernel programmable which unlocks tremendous possibilities.
You can pick any function from the kernel and execute the program every time that function runs. Running a program that “attaches” to network sockets, tracepoints and perf events can be extremely useful. Developers can debug the kernel without having to re-compile it. There are plenty of use cases such as:
- Application performance & troubleshooting
- Networking & security
- Runtime security
- Application tracing
- Observability
That’s what enables tools like Pixie to do blackbox analysis, without requiring any tinkering inside the applications that we’re trying to debug.
Originally BPF was designed for capturing and filtering network packets that matched specific rules, discarding any unwanted packets. That’s why it was called the “Berkeley Packet Filter”. If you’ve ever used tcpdump you’ve probably already used it. Nowadays eBPF can be used for many different things and not just packet filtering but the name stuck for some reason.
This architecture of network monitoring was vastly superior to the current existing packet capture technologies in terms of performance, mainly because the filtering was done in the kernel instead of copying all of the packets in user space and doing the calculations there. But with the advancement of processors it didn’t hold up so well with it’s initial design. That’s why the extended BPF (eBPF) design was introduced, to take advantage of the modern processing power.
Initially eBPF was to be also used as a network packet filtering solution, but the ability to run user-space programs inside the kernel proved to be very powerful. The new design extended what the BPF virtual machine could do, which was to allow it to run on all kinds of events, not just packets, and also do certain actions instead of just the ability to filter things.
How does it work?
An eBPF program is just a sequence of 64-bit instructions. The virtual machine’s instruction set is fairly limited and it has two goals in mind:
- The code needs to be executed as fast as possible.
- All BPF instructions must be verifiable at load time to ensure the safety of the kernel.
Okay so, eBPF code is run in a safe virtual machine inside the kernel. Writing these programs is done with the help of some frameworks (like bcc and bpftrace) and the program bytecode is then loaded via the bpf system call.
To nullify the security and stability risks when running a user space program inside the kernel, several checks are performed to ensure that the code we run is safe and that it terminates so our computer won’t freeze up.
Firstly, to even be able to run a user program which loads eBPF code, it needs root privileges to do so, unless unprivileged eBPF is enabled, in which case the process can load a program with a reduced functionality. Secondly, there’s the eBPF verifier which all eBPF programs must go through before they can be executed.
The verifier runs several checks on the code that safeguards the kernel. The first check ensures that any unbounded loops which could freeze up the kernel are prohibited. The second check, which is more extensive, simulates the execution of the code making sure that all paths of the code run to completion, no out of bounds memory is accessed and overall the state of the virtual machine is valid.
The last step of the verification process involves restricting the eBPF program abilities, which kernel functions are callable and which data it can access. The verifier knows how to apply those restrictions because of the program type. The program type is determined when we associate the program with a certain event.
After the verification process is done, the BPF bytecode is then interpreted, or compiled by a JIT compiler, into native instructions that run efficiently whenever an event happens in the kernel.
kprobes & uprobes
We can create and insert kernel probes or kprobes for short to virtually any function in the kernel, and attach an eBPF program so that it executes each time that function is invoked.
Here’s a simple hello world example from the bcc repository:
from bcc import BPF
from bcc.utils import printb
# define BPF program
prog = """
int hello(void *ctx) {
    bpf_trace_printk("Hello, World!\\n");
    return 0;
}
"""
# load BPF program
b = BPF(text=prog)
b.attach_kprobe(event=b.get_syscall_fnname("clone"), fn_name="hello")
# header
print("%-18s %-16s %-6s %s" % ("TIME(s)", "COMM", "PID", "MESSAGE"))
# format output
while 1:
    try:
        (task, pid, cpu, flags, ts, msg) = b.trace_fields()
    except ValueError:
        continue
    except KeyboardInterrupt:
        exit()
    printb(b"%-18.9f %-16s %-6d %s" % (ts, task, pid, msg))
The eBPF program is written in a pseudo-C code and it’s placed in the variable prog as a string. The bcc framework does all the heavy lifting of generating the bytecode, loading the programs and all that stuff, which makes writing these programs a bit easier.
In this example, the hello function invokes a bpf helper function called bpf_trace_printk which outputs a “Hello, World!” trace. Then we load the program and we attach a kernel probe for the clone event, basically saying that we want to call the hello program each time clone is called.
After that the script waits for new traces to arrive, fetches the fields and prints the values to the screen.
Let’s try running it:
$ sudo python3 hello-ebpf.py
TIME(s)            COMM             PID    MESSAGE
The script has successfully loaded the program and now we wait for the traces to arrive. The next thing to do is to try and invoke the clone syscall. We can run any command on the terminal, such as ls and a child process will be created. Since I had firefox running, it created some child processes in the meantime and traces started to show up:
611.247475000 firefox 5378 Hello, World!
As we can see, the message “Hello, World!” is printed on the screen along with the other trace fields. Super cool!
Besides attaching to kernel functions, we could also observe functions invoked in user space, such as malloc or strlen. This is possible via another Linux kernel feature - uprobes.
Here’s an interesting script that counts frequencies of strings by tracing strlen() and using a hash map to store the strings along with the count of their recurrence: https://github.com/iovisor/bcc/blob/master/examples/tracing/strlen_count.py
helper functions
Since arbitrary kernel functions are prohibited to be called by ebpf programs, there are several helper functions which the kernel provides for us, such as the bpf_trace_printk function. We can use them to:
- Get the current time
- Interact with eBPF maps
- Manipulate network packets
- Print debugging messages
Note that each program can only use a subset of these helpers because of the different contexts the programs can run in. Here’s the extensive list of bpf helpers.
map storage
To write more complicated programs you’ll need some type of data store, and that is where maps come in. They are an important part of the BPF internal system, which allows programs to store information that can be accessed from userspace.
BPF supports different types of data stores - you can use a hash map, an array, or even a stack or a queue, depending on the use case of course.
conclusion
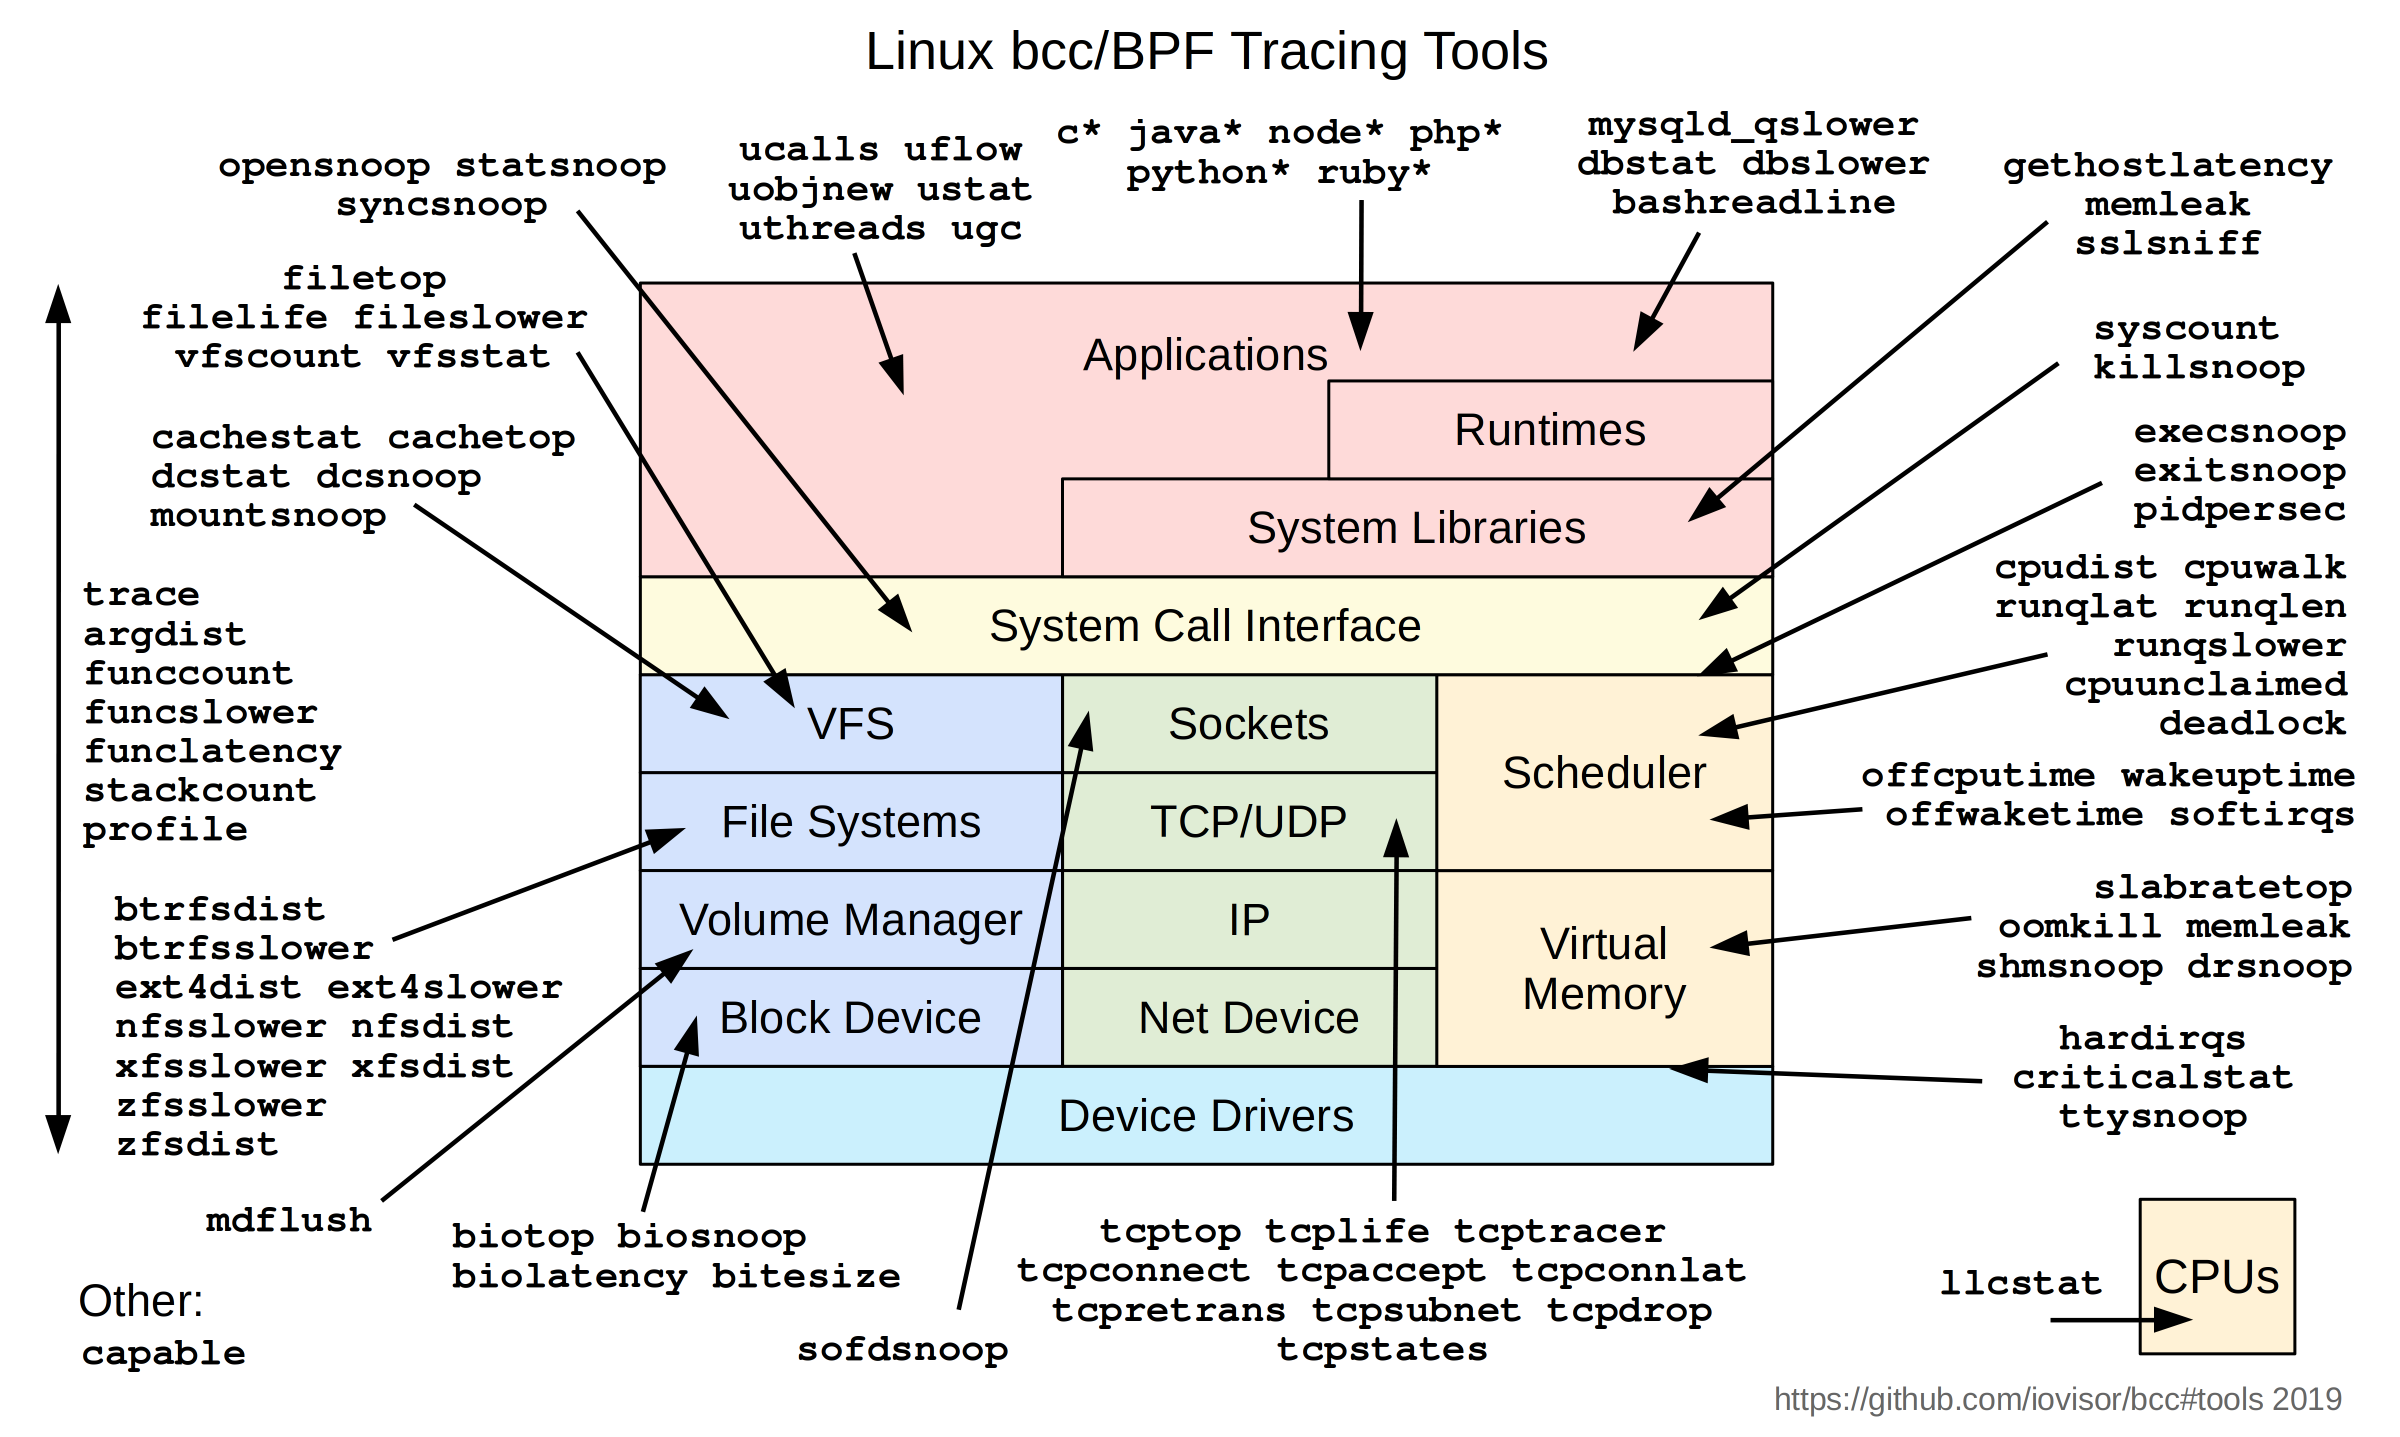
eBPF opens up all kinds of possibilities for observability. You can treat a system as a blackbox, without really knowing anything about it, and run all kinds of interesting analysis: count the most frequently called functions, trace network packets, do performance tracing and debugging, etc.
There are a myriad of tools that you can use to observe every component of the system: the CPU, memory, file system, networking, containers, applications…
I’ve only scratched the surface on this subject and I can’t wait to learn more about it, as well as Linux performance in general. There’s tons of great posts and videos on this exciting technology, and I’ve left some links below for you. Cheers!
References
- https://www.tcpdump.org/papers/bpf-usenix93.pdf – BPF paper
- https://lwn.net/Articles/740157/ – A thorough introduction to eBPF
- https://www.youtube.com/watch?v=16slh29iN1g – interesting talk by Brendan Gregg on BPF performance analysis at Netflix
- http://www.brendangregg.com/ebpf.html – eBPF trace tools
- https://github.com/iovisor/bcc/blob/master/docs/reference_guide.md – BCC reference guide