Distributed tracing for Go
Jaana Burcu Dogan
Engineer
The Go programming language has emerged as a popular choice for building distributed systems and microservices. But troubleshooting Go-based microservices can be tough if you don’t have the right tooling. Here at Google Cloud, we’re big fans of Go, and we recently added a native Go client library to Stackdriver Trace, our distributed tracing backend to help you unearth (and resolve) difficult performance problems for any Go application, whether it runs on Google Cloud Platform (GCP) or some other cloud.
The case for distributed tracing
Suppose you're trying to troubleshoot a latency problem for a specific page. Suppose your system is made of many independent services and the data on the page is generated through many downstream services. You have no idea which of those services are causing the slowdown. You have no clear understanding of whether it’s a bug, an integration issue, a bottleneck due to poor choice of architecture or poor networking performance.Solving this problem becomes even more difficult if your services are running as separate processes in a distributed system. We cannot depend on the traditional approaches that help us diagnose monolithic systems. We need to have finer-grained visibility into what’s going on inside each service and how they interact with one another over the lifetime of a user request.
In monolithic systems, it's relatively easy to collect diagnostic data from the building blocks of a program. All modules live within one process and share common resources to report logs, errors and other diagnostics information. Once your system grows beyond a single process and starts to become distributed, it becomes harder to follow a call starting from the front-end web server to all of its back-ends until a response is returned back to the user.


To address this problem, Google developed the distributed tracing system Dapper to instrument and analyze its production services. The Dapper paper has inspired many open source projects, such as Zipkin, and Dapper-style tracing has emerged as an industry-wide standard.
Distributed tracing enabled us to:
- Instrument and profile application latency in a large system.
- Track all RPCs within the lifecycle of a user request and see integration issues that are only visible in production.
- Figure out performance improvements that can be applied to our systems. Many bottlenecks are not obvious before the collection of tracing data.
Tracing concepts
Tracing works on the basic principle of propagating tracing data between services. Each service annotates the trace with additional data and passes the tracing header to other services until the user request is served. Services are responsible for uploading their traces to a tracing backend. Then, the tracing backend puts related latency data together like the pieces of a puzzle. Tracing backends also provide UIs to analyze and visualize traces.In Dapper-style tracing, each trace is a call tree, beginning with the entry point of a user request and ending with the server’s response, including all RPCs along the way. Each trace consists of small units called spans.


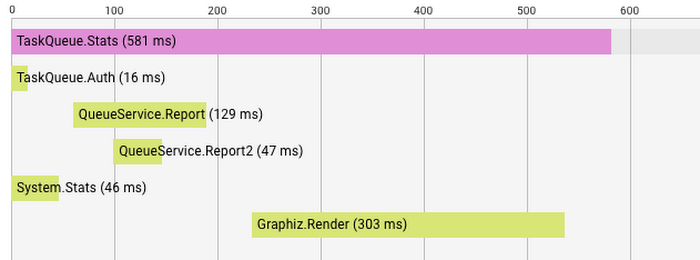
Above, you see a trace tree for a TaskQueue.Stats request. Each row is labelled with the span name. Before the system can serve TaskQueue.Stats, five other RPCs have been made to other services. First, TaskQueue.Auth checks if we're authorized for the request. Then, QueueService is queried for two reports. In the meantime, System.Stats is retrieved from another service. Once reports and system stats are retrieved, the Graphiz service renders a graph. In total, TaskQueue.Stats returns in 581 ms, and we have a good picture of what has happened internally to serve this call. By looking at this trace, maybe we'll learn that rendering is taking more time than we expect.
Each span name should be carefully chosen to represent the work it does. For example, TaskQueue.Stats is easily identified within the system and, as its name implies, reads stats from the TaskQueue service.
Spans can start new spans where a span depends on other spans to be completed. These spans are visualized as children spans of their starter span in a trace tree.
Spans can also be annotated with labels to convey more fine-grained information about a specific request. Request ID, user IDs and RPC parameters are good examples of labels commonly attached to traces. Choose labels by determining what else you want to see in a particular trace tree and what you would like to query from the collected data.
Working with Stackdriver Trace
One of the exciting things about GCP is that customers can use the same services and tools we use daily at Google-scale. We launched Stackdriver Trace to provide a distributing tracing backend for our customers. Stackdriver Trace collects latency data from your applications, lists and visualizes it on Cloud Console, and allows you to analyze your application’s latency profile. Your code doesn’t have to run on GCP to use Stackdriver Trace — we can upload your trace data to our backends even if your production environment doesn’t run on our cloud.To collect latency data, we recently released the cloud.google.com/go/trace package for Go programmers to instrument their code with marking spans and annotations. Please note that the trace package is still in alpha and we're looking forward to improving it over time. At this stage, please feel free to file bugs and feature requests.
To run this sample, you’ll need Google Application Default Credentials. First, use the gcloud command line tool to get application default credentials if you haven’t already.
Then, import the trace package:
Create a new trace client with your project ID:
We recommend you have a long-living trace.Client instance. You can create a client once and keep using it until your program terminates.
The sample program makes an outgoing HTTP request. In this example, we attach tracing information to the outgoing HTTP request so that the trace can be propagated to the destination server:
The User service extracts the tracing information from the incoming request, and creates and annotates any additional child spans. In this way, the trace of a single request can be propagated between many different systems:
Alternatively, you can also use the HTTP utilities to easily add tracing context to outgoing requests via HTTPClient, and extract the spans from incoming requests with HTTPHandler.
And on the receiving side, you can use our handler wrapper to access the span via the incoming request’s context:
A similar utility to enable auto-tracing is also available for gRPC Go clients and servers.
Please note that not all services need to be written in Go — propagation works across all services written in other languages as long as they rely on the Stackdriver header format to propagate the tracing context. See the Stackdriver Trace docs to learn about the header format.
Future work
Even though we currently provide a solution for GCP, our goal is to contribute to the Go ecosystem beyond GCP. There are many groups working on tracing for Go, and there's a lot of work to do to ensure it's aligned. We look forward to working with these groups to make tracing accessible and easy for Go programmers.One particular problem we want to solve is enabling third-party library authors to provide out-of-the-box tracing without depending on a particular tracing backend. Then, open-source library developers can instrument their code by marking spans and annotating them to be traced by the user's choice of tracing backend. We also want to work on reusable utilities to automatically enable tracing anywhere without requiring Go programmers to significantly modify their code.
We're currently working with a large group of industry experts and examining already-established solutions to understand their requirements and provide a solution that will foster our integrations with tracing backends. With these first-class building blocks and utilities, we believe distributed tracing can be a core and accessible tool to diagnose Go production systems.


