You can use actuated's new CLI to calculate the total number of build minutes you're using across an organisation with GitHub Actions.
I'm also going to show you:
- How to build tools rapidly, without worrying
- The best way to connect to the GitHub API using Go
- How to check your remaining rate limit for an access token
- A better way to integrate than using Access Tokens
- Further ways you could develop or contribute to this idea
Why do we need this?
If you log into the GitHub UI, you can request a CSV to be sent to your registered email address. This is a manual process and can take a few minutes to arrive.
It covers any paid minutes that your account has used, but what if you want to know the total amount of build minutes used by your organisation?
We wanted to help potential customers for actuated understand how many minutes they're actually using in total, including free-minutes, self-hosted minutes and paid minutes.
I looked for a way to do this in the REST API and the GraphQL API, but neither of them could give this data easily. It was going to involve writing a lot of boilerplate code, handling pagination, summing in the values and etc.
So I did it for you.
The actions-usage CLI
The new CLI is called actions-usage and it's available on the self-actuated GitHub organisation: self-actuated/actions-usage.
As I mentioned, a number of different APIs were required to build up the picture of true usage:
- Get a list of repositories in an organisation
- Get a list of workflow runs within the organisation for a given date range
- Get a list of jobs for each of those workflow runs
- Add up the minutes and summarise the data
The CLI is written in Go, and there's a binary release available too.
I used the standard Go flags package, because I can have working code quicker than you can say "but I like Cobra!"
flag.StringVar(&orgName, "org", "", "Organization name")
flag.StringVar(&token, "token", "", "GitHub token")
flag.IntVar(&since, "since", 30, "Since when to fetch the data (in days)")

flag.Parse()
In the past, I used to make API calls directly to GitHub using Go's standard library. Eventually I stumbled upon Google's "github-go" library and use it everywhere from within actuated itself, to our Derek bot and other integrations.
It couldn't be any easier to integrate with GitHub using the library:
auth := oauth2.NewClient(context.Background(), oauth2.StaticTokenSource(
  &oauth2.Token{AccessToken: token},
))
page := 0
    opts := &github.RepositoryListByOrgOptions{ListOptions: github.ListOptions{Page: page, PerPage: 100}, Type: "all"}
If you'd like to learn more about the library, I wrote A prototype for turning GitHub Actions into a batch job runner.
The input is a Personal Access Token, but the code could also be rewritten into a small UI portal and use an OAuth flow or GitHub App to authenticate instead.
How to get your usage
The tool is designed to work at the organisation level, but if you look at my example for turning GitHub Actions into a batch job runner, you'll see what you need to change to make it work for a single repository, or to list all repositories within a personal account instead.
Or create a Classic Token with: repo and admin:org and save it to ~/pat.txt. Create a short lived duration for good measure.
Download a binary from the releases page
./actions-usage --org openfaas --token $(cat ~/pat.txt)

Fetching last 30 days of data (created>=2023-01-29)

Total repos: 45
Total private repos: 0
Total public repos: 45

Total workflow runs: 95
Total workflow jobs: 113
Total usage: 6h16m16s (376 mins)
The openfaas organisation has public, Open Source repos, so there's no other way to get a count of build minutes than to use the APIs like we have done above.
What about rate-limits?
If you remember above, I said we first call list repositories, then list workflow runs, then list jobs. We do manage to cut back on rate limit usage by using a date range of the last 30 days.
You can check the remaining rate-limit for an API token as follows:
curl -H "Authorization: token $(cat ~/pat.txt)" \
  -X GET https://api.github.com/rate_limit

{
  "rate": {
    "limit": 5000,
    "used": 300,
    "remaining": 4700,
    "reset": 1677584468
  }
I ran the tool twice and only used 150 API calls each time. In an ideal world, GitHub would add this to their REST API since they have the data already. I'll mention an alternative in the conclusion, which gives you the data, and insights in an easier way.
But if your team has hundreds of repositories, or thousands of builds per month, then the tool may exit early due to exceeding the API rate-limit. In this case, we suggest you run with -days=10 and multiply the value by 3 to get a rough picture of 30-day usage.
Further work
The tool is designed to be used by teams and open source projects, so they can get a grasp of total minutes consumed.
Why should we factor in the free minutes?
Free minutes are for GitHub's slowest runners. They're brilliant a lot of the time, but when your build takes more than a couple of minutes, become a bottleneck and slow down your team.
Ask me how I know.
So we give you one figure for total usage, and you can then figure out whether you'd like to try faster runners with flat rate billing, with each build running in an immutable Firecracker VM or stay as you are.
What else could you do with this tool?
You could build a React app, so users don't need to generate a Personal Access Token and to run a CLI.
You could extend it to work for personal accounts as well as organisations. Someone has already suggested that idea here: How can I run this for a user account? #2
The code is open source and available on GitHub:
This tool needed to be useful, not perfect, so I developed in my "Rapid Prototyping" style.
My new style for rapid prototyping in @golang:
— Alex Ellis (@alexellisuk) October 8, 2022
* All code goes in main.go, in main(), no extra methods, no packages, no extra files
* Use Go's flags and log packages
* Maybe create a few separate methods/files, still in the main package
For as long as possible.. pic.twitter.com/9TEpN6XSCA
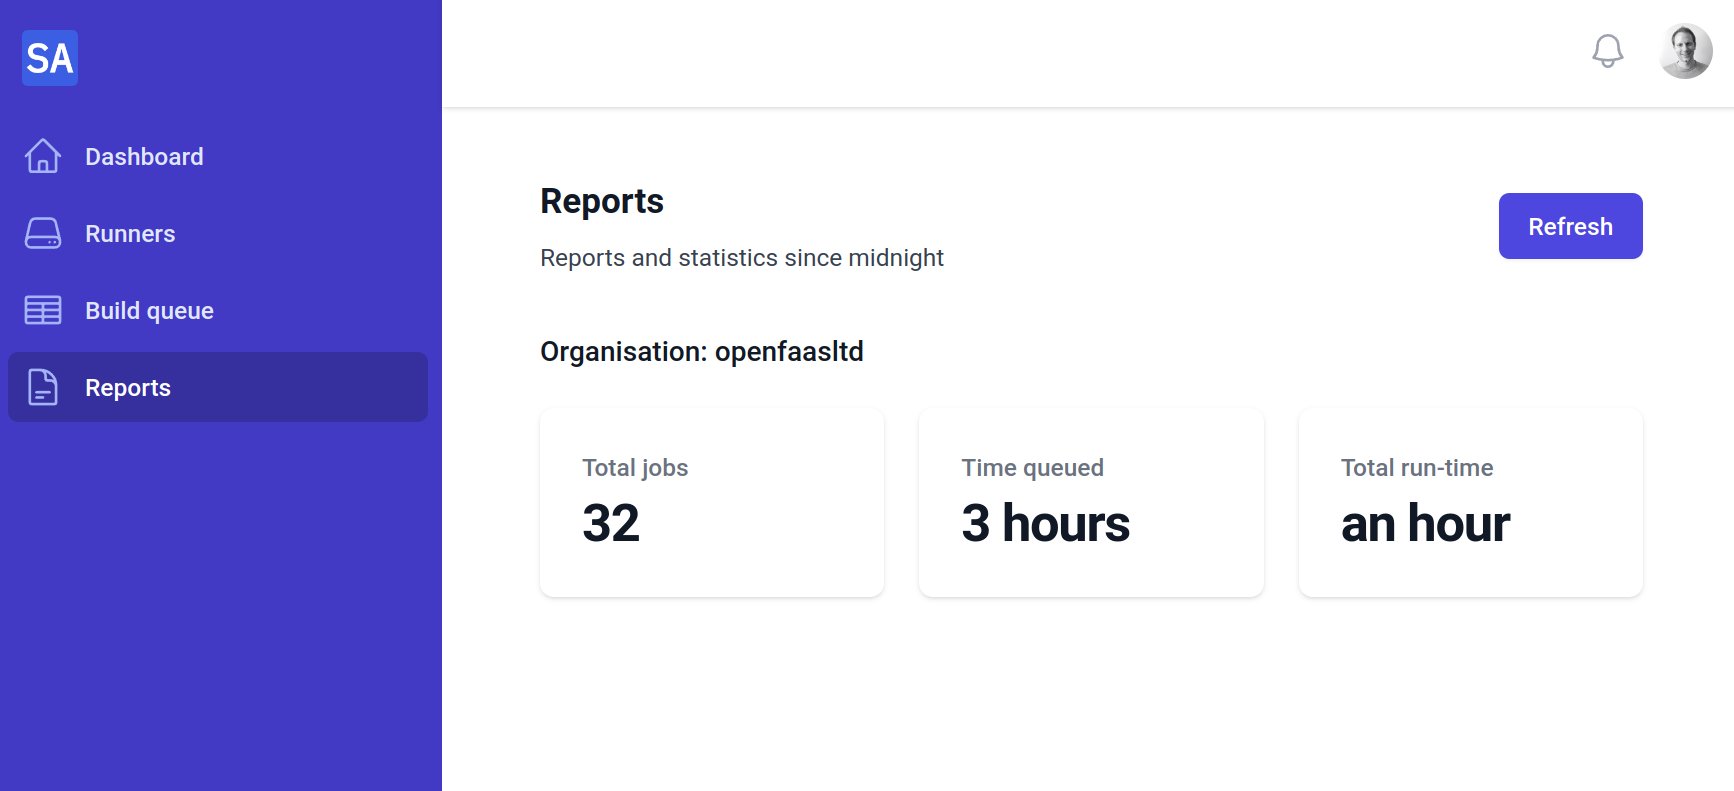
If you'd like to gain more insights on your usage, to adopt Arm builds or speed up your team, Actuated users don't currently need to run tools like this to track their usage, we do it automatically for them and bubble it up through reports:
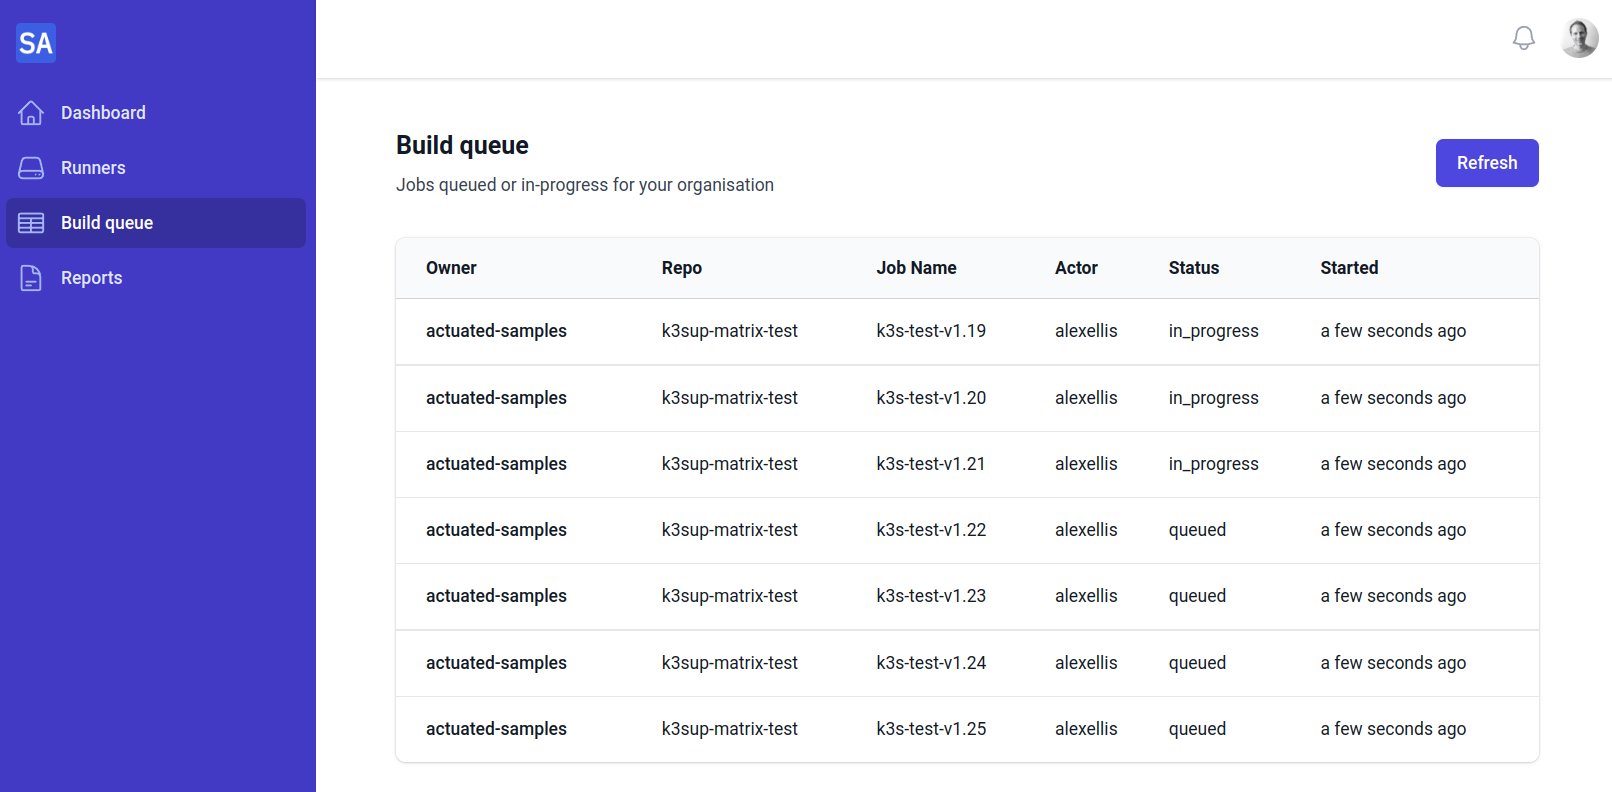
Actuated can also show jobs running across your whole organisation, for better insights for Team Leads and Engineering Managers:
Find out more about what we're doing to make self-hosted runners quicker, more secure and easier to observe at actuated.dev