12,577 reads
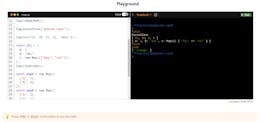
Interactive Charts with Go (GL)


Too Long; Didn't Read
In recent years, since the arrival of <a href="https://d3js.org/" target="_blank">D3.js</a>, whenever there is a task involving charts or graph visualisation I tend to gravitate towards JavaScript libraries. This is mainly because D3.js provides an easy way to bring data to life using HTML, SVG, and CSS, with a data-driven approach. It’s easy to customise and integrate for your own use case, and there are plethora of beautiful interactive chart examples out there.Companies Mentioned


Wan Bachtiar
@sindbach

L O A D I N G
. . . comments & more!
. . . comments & more!
About Author

TOPICS
THIS ARTICLE WAS FEATURED IN...


RELATED STORIES


ML.NET Sentiment Analysis with MongoDB #mongodb
Sep 24, 2018


You Don’t Need JavaScript Native Methods! #javascript
Apr 19, 2024