SSA performance numbers
8,175 views
Skip to first unread message

Keith Randall
Mar 11, 2016, 12:09:00 AM3/11/16
to golang-dev
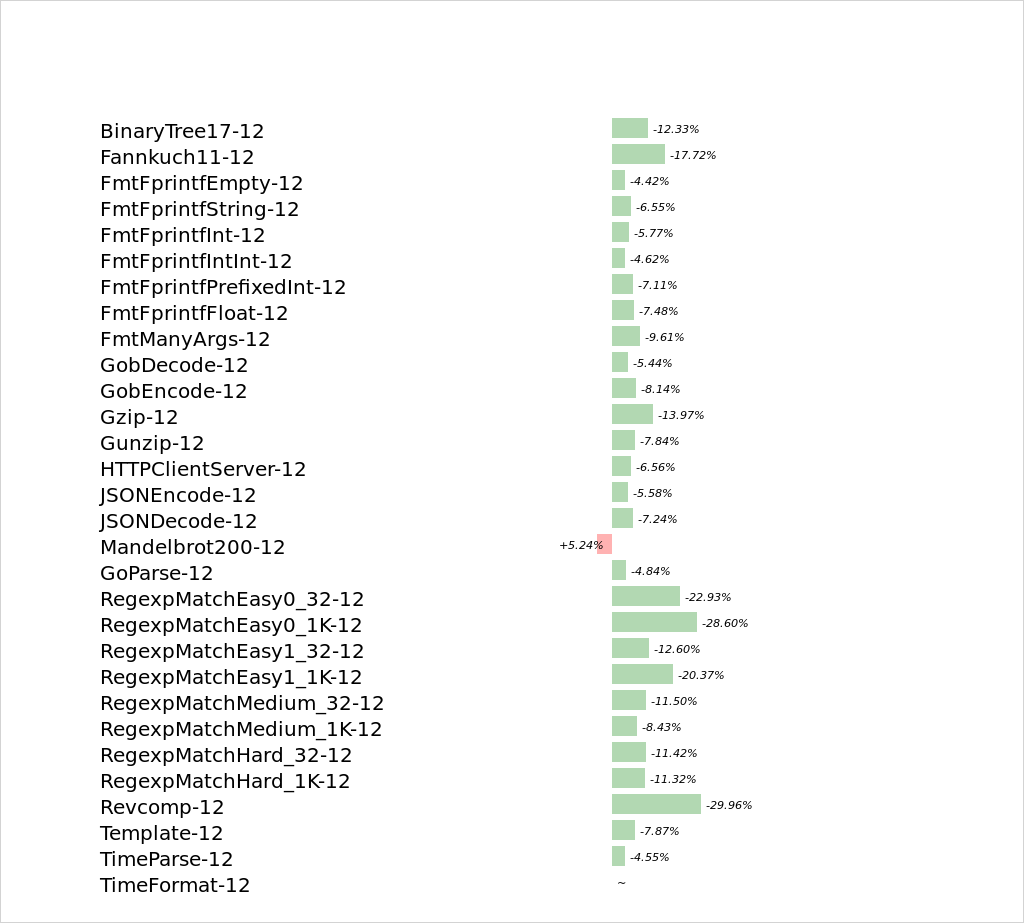
Here's the current performance numbers for the go1 benchmarks, comparing tip relative to go1.6:
name old time/op new time/op delta
BinaryTree17-12 3.16s ±14% 2.77s ± 3% -12.33% (p=0.000 n=10+9)
Fannkuch11-12 2.68s ± 1% 2.21s ± 1% -17.72% (p=0.000 n=10+9)
FmtFprintfEmpty-12 52.5ns ± 3% 50.2ns ± 2% -4.42% (p=0.000 n=10+10)
FmtFprintfString-12 175ns ± 1% 163ns ± 0% -6.55% (p=0.000 n=9+9)
FmtFprintfInt-12 170ns ± 6% 160ns ± 0% -5.77% (p=0.000 n=10+8)
FmtFprintfIntInt-12 272ns ± 0% 260ns ± 1% -4.62% (p=0.000 n=8+9)
FmtFprintfPrefixedInt-12 245ns ± 1% 228ns ± 0% -7.11% (p=0.000 n=9+8)
FmtFprintfFloat-12 328ns ± 1% 303ns ± 1% -7.48% (p=0.000 n=9+8)
FmtManyArgs-12 1.06µs ± 2% 0.96µs ± 0% -9.61% (p=0.000 n=10+9)
GobDecode-12 8.20ms ± 3% 7.75ms ± 2% -5.44% (p=0.000 n=8+9)
GobEncode-12 6.99ms ± 1% 6.42ms ± 2% -8.14% (p=0.000 n=10+9)
Gzip-12 336ms ± 1% 289ms ± 1% -13.97% (p=0.000 n=9+9)
Gunzip-12 44.2ms ± 1% 40.7ms ± 1% -7.84% (p=0.000 n=9+10)
HTTPClientServer-12 223µs ± 7% 208µs ± 6% -6.56% (p=0.000 n=10+10)
JSONEncode-12 17.7ms ± 1% 16.7ms ± 1% -5.58% (p=0.000 n=8+9)
JSONDecode-12 58.6ms ± 0% 54.3ms ± 1% -7.24% (p=0.000 n=9+8)
Mandelbrot200-12 4.18ms ± 3% 4.40ms ± 1% +5.24% (p=0.000 n=10+9)
GoParse-12 3.74ms ± 2% 3.56ms ± 2% -4.84% (p=0.000 n=9+10)
RegexpMatchEasy0_32-12 102ns ± 1% 79ns ± 0% -22.93% (p=0.000 n=10+10)
RegexpMatchEasy0_1K-12 352ns ± 1% 251ns ± 0% -28.60% (p=0.000 n=8+10)
RegexpMatchEasy1_32-12 87.5ns ± 0% 76.5ns ± 1% -12.60% (p=0.000 n=8+10)
RegexpMatchEasy1_1K-12 515ns ± 1% 410ns ± 3% -20.37% (p=0.000 n=10+10)
RegexpMatchMedium_32-12 138ns ± 1% 122ns ± 1% -11.50% (p=0.000 n=10+10)
RegexpMatchMedium_1K-12 40.4µs ± 1% 37.0µs ± 0% -8.43% (p=0.000 n=10+10)
RegexpMatchHard_32-12 2.19µs ± 1% 1.94µs ± 4% -11.42% (p=0.000 n=8+10)
RegexpMatchHard_1K-12 66.2µs ± 1% 58.7µs ± 2% -11.32% (p=0.000 n=9+10)
Revcomp-12 594ms ± 1% 416ms ± 8% -29.96% (p=0.000 n=8+10)
Template-12 70.5ms ± 1% 65.0ms ± 1% -7.87% (p=0.000 n=8+10)
TimeParse-12 358ns ± 1% 341ns ± 0% -4.55% (p=0.000 n=10+9)
TimeFormat-12 363ns ± 1% 369ns ± 7% ~ (p=0.186 n=9+10)
Attached are the same numbers in graphical form.
Tip compiler (with SSA internal checks off) is about 7% slower than go1.6 to compile net/http (go test -a -c -gcflags=-d=ssa/check/off net/http)

Robert Griesemer
Mar 11, 2016, 12:26:17 AM3/11/16
to Keith Randall, golang-dev
Great improvements!
- gri
--
You received this message because you are subscribed to the Google Groups "golang-dev" group.
To unsubscribe from this group and stop receiving emails from it, send an email to golang-dev+...@googlegroups.com.
For more options, visit https://groups.google.com/d/optout.

Brendan Tracey
Mar 11, 2016, 12:30:48 AM3/11/16
to Robert Griesemer, Keith Randall, golang-dev
Here was my post earlier today on issue 14511. Ddot is a numeric benchmark
for i, v := range a {
sum += v * b[i]
}
though, a and b can have strides instead of being only linear
DdotSmallBothUnitary-8   17.6ns ± 1%  15.6ns ± 2%  -11.28%  (p=0.008 n=5+5)
DdotSmallIncUni-8        21.9ns ± 1%  21.9ns ± 1%     ~     (p=0.952 n=5+5)
DdotSmallUniInc-8        21.2ns ± 1%  20.2ns ± 0%   -4.54%  (p=0.000 n=5+4)
DdotSmallBothInc-8       21.1ns ± 0%  20.8ns ± 1%   -1.42%  (p=0.016 n=5+5)
DdotMediumBothUnitary-8   851ns ± 1%   843ns ± 1%   -1.01%  (p=0.032 n=5+5)
DdotMediumIncUni-8       1.17µs ± 1%  0.95µs ± 0%  -18.32%  (p=0.008 n=5+5)
DdotMediumUniInc-8       1.12µs ± 0%  0.86µs ± 1%  -22.91%  (p=0.008 n=5+5)
DdotMediumBothInc-8      1.21µs ± 1%  0.99µs ± 2%  -18.72%  (p=0.008 n=5+5)
DdotLargeBothUnitary-8   85.9µs ± 1%  83.0µs ± 1%   -3.33%  (p=0.008 n=5+5)
DdotLargeIncUni-8         169µs ± 1%   154µs ± 1%   -8.97%  (p=0.008 n=5+5)
DdotLargeUniInc-8         121µs ± 1%   106µs ± 1%  -11.99%  (p=0.008 n=5+5)
DdotLargeBothInc-8        241µs ± 1%   230µs ± 1%   -4.26%  (p=0.008 n=5+5)
DdotHugeBothUnitary-8    10.6ms ± 1%  10.1ms ± 1%   -4.59%  (p=0.008 n=5+5)
DdotHugeIncUni-8         25.8ms ± 1%  25.6ms ± 3%     ~     (p=0.151 n=5+5)
DdotHugeUniInc-8         17.7ms ± 1%  16.7ms ± 1%   -5.81%  (p=0.016 n=5+4)
DdotHugeBothInc-8        33.0ms ± 0%  33.2ms ± 1%     ~     (p=0.151 n=5+5)
oju...@gmail.com
Mar 11, 2016, 7:35:19 AM3/11/16
to golang-dev
Congratulations, Keith. The speedup of generated code is truly noteworthy. I think the performance of the compiler proper can be improved over time, as you have proved more than once these days.

reini...@gmail.com
Mar 11, 2016, 11:30:22 AM3/11/16
to golang-dev
Am Freitag, 11. März 2016 06:09:00 UTC+1 schrieb Keith Randall:
Here's the current performance numbers for the go1 benchmarks, comparing tip relative to go1.6:name old time/op new time/op delta
...
Mandelbrot200-12 4.18ms ± 3% 4.40ms ± 1% +5.24% (p=0.000 n=10+9)
Nice
This is the only outlier, and 4.18ms is long enough that it cannot be the SSA construction overhead alone.
Did you check what's the deal with that?
Keith Randall
Mar 11, 2016, 11:48:48 AM3/11/16
to reini...@gmail.com, golang-dev
Mandelbrot has a ~15 instruction inner loop. The old compiler's peephole
optimizer can get down to one less reg->reg move than the SSA compiler can.
I hope to get that out with another tweak to register allocation.
Note the go1 timings do not include compile time.

vess...@gmail.com
Mar 11, 2016, 1:09:36 PM3/11/16
to golang-dev
Keith, this is great.
I ran tip against our server tool which has the following workload:
Load and parse roughly 100GB of data into 200GB or RAM
Do some full dataset computations for caching
The code is heavily parallelized and reasonably well tuned. We instrumented it to exit after 'ready' status was achieved, and used the time utility to time it, so these numbers include freeing up OS RAM at end of the run.
I ran each version of the binary once and then threw away the numbers to let Linux do what it could on caching the file reads. Then I ran each three times. The results look great for tip.
Results vs go1.6:
Go 1.6 Tip
------------- ---------
25.2s 22.2s
27.3s 22.1s
25.3s 22.2s
So this is a big win for us, thanks, and it's nice to see these improvements show up in a large codebase with varied kinds of work.
There do seem to be some performance regressions for a few functions, but it might be noise, or old data on our part. If I can find any areas that seem much slower and can get it drilled down to something repeatable, I will follow up. In any event, these numbers include those regressions (if any) so there might be even more good news ahead.
Peter
Keith Randall
Mar 11, 2016, 1:16:31 PM3/11/16
to vess...@gmail.com, golang-dev
On Fri, Mar 11, 2016 at 10:06 AM, <vess...@gmail.com> wrote:
Keith, this is great.I ran tip against our server tool which has the following workload:Load and parse roughly 100GB of data into 200GB or RAMDo some full dataset computations for cachingThe code is heavily parallelized and reasonably well tuned. We instrumented it to exit after 'ready' status was achieved, and used the time utility to time it, so these numbers include freeing up OS RAM at end of the run.I ran each version of the binary once and then threw away the numbers to let Linux do what it could on caching the file reads. Then I ran each three times. The results look great for tip.Results vs go1.6:Go 1.6 Tip------------- ---------25.2s 22.2s27.3s 22.1s25.3s 22.2sSo this is a big win for us, thanks, and it's nice to see these improvements show up in a large codebase with varied kinds of work.There do seem to be some performance regressions for a few functions, but it might be noise, or old data on our part. If I can find any areas that seem much slower and can get it drilled down to something repeatable, I will follow up. In any event, these numbers include those regressions (if any) so there might be even more good news ahead.
Yes, if you see regressions in particular bits of code please let me know.
--
Reply all
Reply to author
Forward
0 new messages