Porcupine is a fast linearizability checker for testing the correctness of distributed systems. It takes a sequential specification as executable Go code, along with a concurrent history, and it determines whether the history is linearizable with respect to the sequential specification. Porcupine also implements a visualizer for histories and linearization points.
(click for interactive version)
Porcupine implements the algorithm described in Faster linearizability checking via P-compositionality, an optimization of the algorithm described in Testing for Linearizability.
Porcupine is faster and can handle more histories than Knossos's
linearizability checker. Testing on the data in test_data/jepsen/, Porcupine
is generally 1,000x-10,000x faster and has a much smaller memory
footprint. On histories where it can take advantage of P-compositionality,
Porcupine can be millions of times faster.
Porcupine takes an executable model of a system along with a history, and it runs a decision procedure to determine if the history is linearizable with respect to the model. Porcupine supports specifying history in two ways, either as a list of operations with given call and return times, or as a list of call/return events in time order. Porcupine can also visualize histories, along with partial linearizations, which may aid in debugging.
See the documentation for how to write a model and specify histories. You can also check out some example implementations of models from the tests.
Once you've written a model and have a history, you can use the
CheckOperations and CheckEvents functions
to determine if your history is linearizable. If you want to visualize a
history, along with partial linearizations, you can use the
Visualize function.
Suppose we're testing linearizability for operations on a read/write register
that's initialized to 0. We write a sequential specification for the register
like this:
type registerInput struct {
op bool // false = put, true = get
value int
}
// a sequential specification of a register
registerModel := porcupine.Model{
Init: func() interface{} {
return 0
},
// step function: takes a state, input, and output, and returns whether it
// was a legal operation, along with a new state
Step: func(state, input, output interface{}) (bool, interface{}) {
regInput := input.(registerInput)
if regInput.op == false {
return true, regInput.value // always ok to execute a put
} else {
readCorrectValue := output == state
return readCorrectValue, state // state is unchanged
}
},
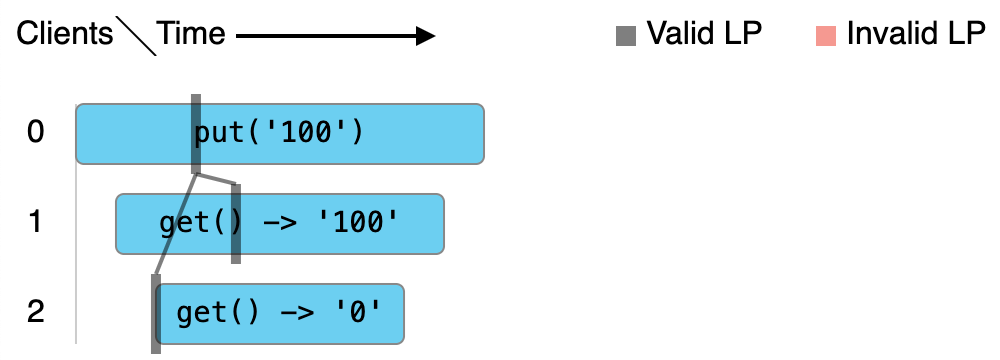
}Suppose we have the following concurrent history from a set of 3 clients. In a
row, the first | is when the operation was invoked, and the second | is
when the operation returned.
C0:  |-------- put('100') --------|
C1:     |--- get() -> '100' ---|
C2:        |- get() -> '0' -|
We encode this history as follows:
events := []porcupine.Event{
    // C0: put('100')
    {Kind: porcupine.CallEvent, Value: registerInput{false, 100}, Id: 0, ClientId: 0},
    // C1: get()
    {Kind: porcupine.CallEvent, Value: registerInput{true, 0}, Id: 1, ClientId: 1},
    // C2: get()
    {Kind: porcupine.CallEvent, Value: registerInput{true, 0}, Id: 2, ClientId: 2},
    // C2: Completed get() -> '0'
    {Kind: porcupine.ReturnEvent, Value: 0, Id: 2, ClientId: 2},
    // C1: Completed get() -> '100'
    {Kind: porcupine.ReturnEvent, Value: 100, Id: 1, ClientId: 1},
    // C0: Completed put('100')
    {Kind: porcupine.ReturnEvent, Value: 0, Id: 0, ClientId: 0},
}
We can have Porcupine check the linearizability of the history as follows:
ok := porcupine.CheckEvents(registerModel, events)
// returns true
Porcupine can visualize the linearization points as well:
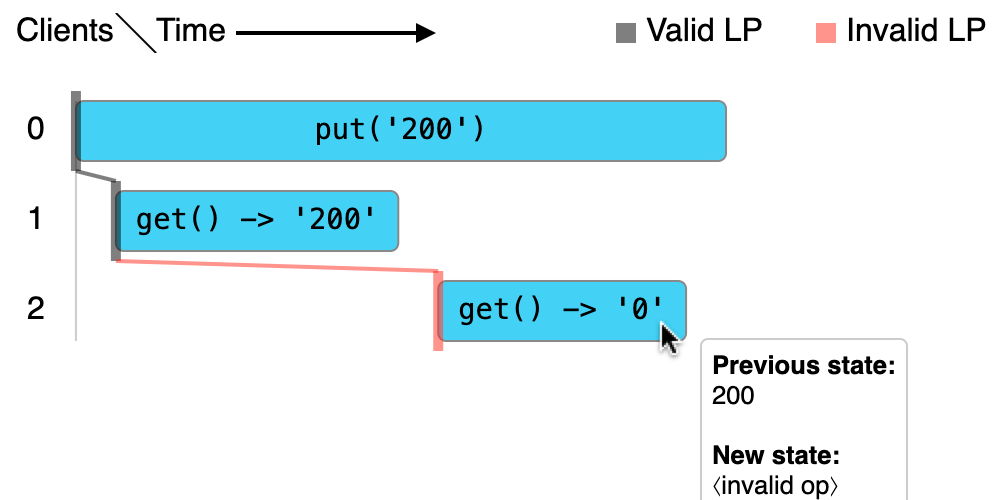
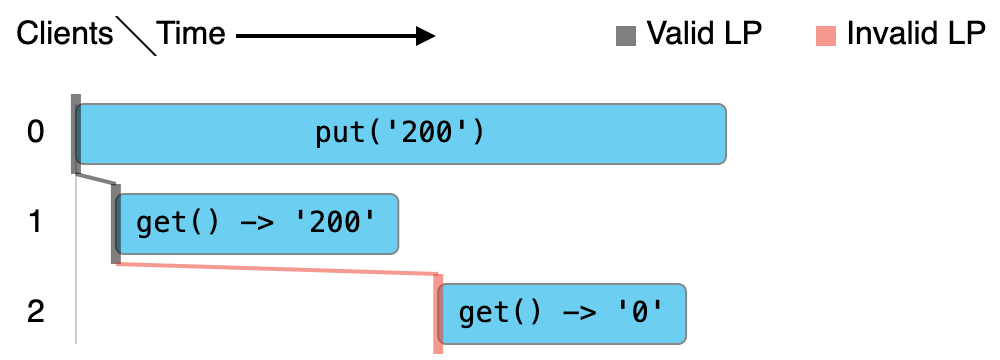
Now, suppose we have another history:
C0:  |---------------- put('200') ----------------|
C1:    |- get() -> '200' -|
C2:                           |- get() -> '0' -|
We can check the history with Porcupine and see that it's not linearizable:
events := []porcupine.Event{
    // C0: put('200')
    {Kind: porcupine.CallEvent, Value: registerInput{false, 200}, Id: 0, ClientId: 0},
    // C1: get()
    {Kind: porcupine.CallEvent, Value: registerInput{true, 0}, Id: 1, ClientId: 1},
    // C1: Completed get() -> '200'
    {Kind: porcupine.ReturnEvent, Value: 200, Id: 1, ClientId: 1},
    // C2: get()
    {Kind: porcupine.CallEvent, Value: registerInput{true, 0}, Id: 2, ClientId: 2},
    // C2: Completed get() -> '0'
    {Kind: porcupine.ReturnEvent, Value: 0, Id: 2, ClientId: 2},
    // C0: Completed put('200')
    {Kind: porcupine.ReturnEvent, Value: 0, Id: 0, ClientId: 0},
}

ok := porcupine.CheckEvents(registerModel, events)
// returns false
See porcupine_test.go for more examples on how to write
models and histories.
Porcupine provides functionality to visualize histories, along with the linearization (or partial linearizations and illegal linearization points, in the case of a non-linearizable history). The result is an HTML page that draws an interactive visualization using JavaScript. The output looks like this:
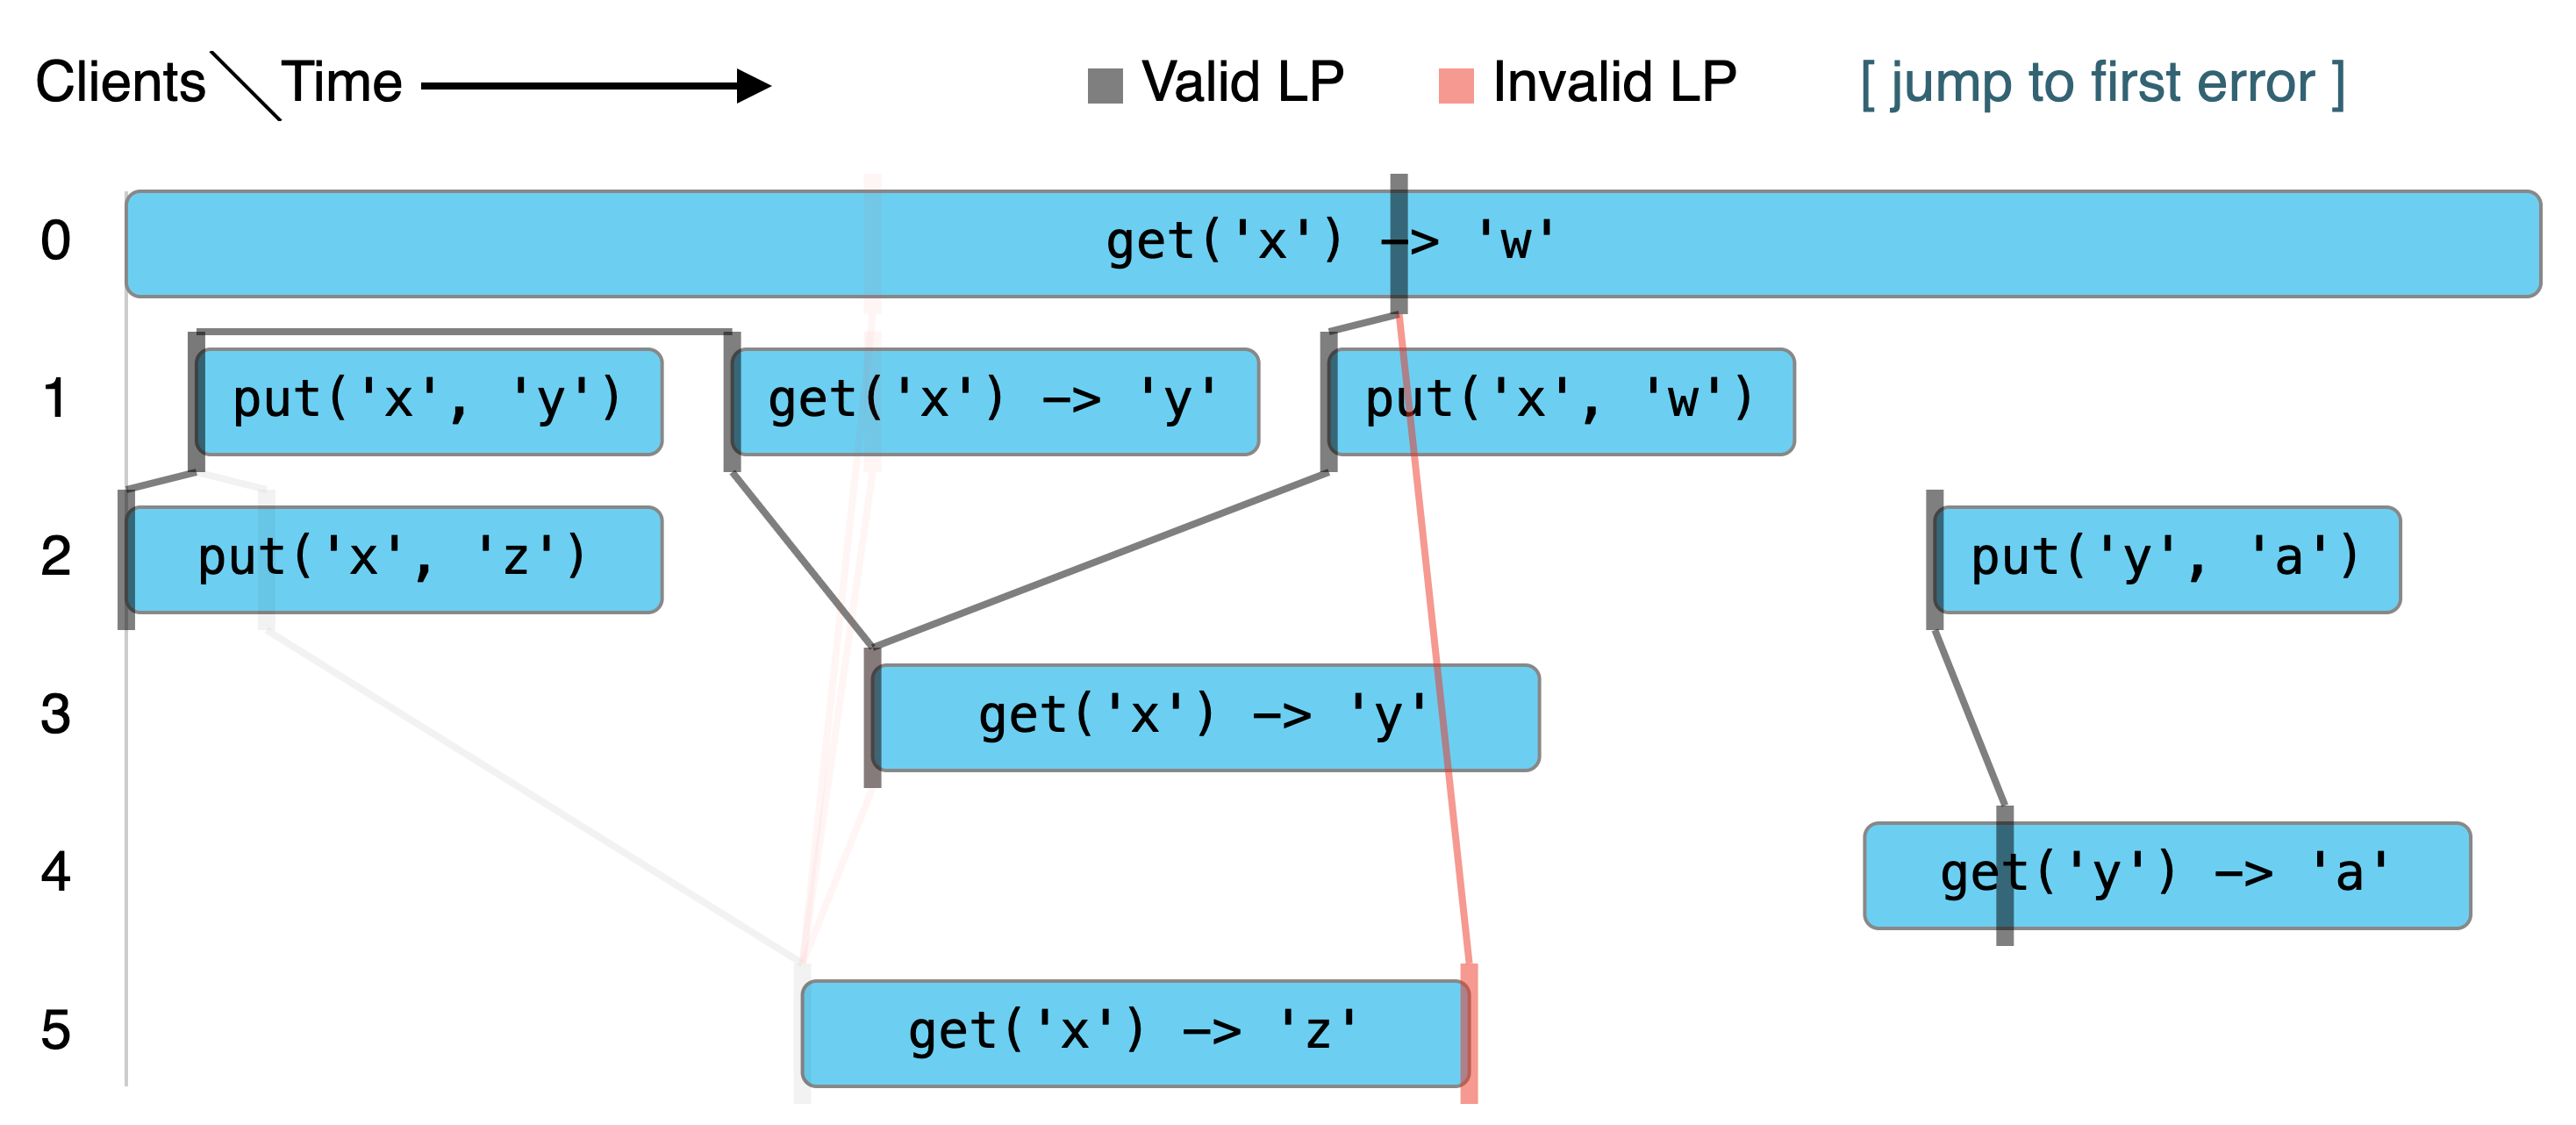
You can see the full interactive version here.
The visualization is by partition: all partitions are essentially independent, so with the key-value store example above, operations related to each unique key are in a separate partition.
Statically, the visualization shows all history elements, along with linearization points for each partition. If a partition has no full linearization, the visualization shows the longest partial linearization. It also shows, for each history element, the longest partial linearization containing that event, even if it's not the longest overall partial linearization; these are greyed out by default. It also shows illegal linearization points, history elements that were checked to see if they could occur next but which were illegal to linearize at that point according to the model.
When a history element is hovered over, the visualization highlights the most relevant partial linearization. When it exists, the longest partial linearization containing the event is shown. Otherwise, when it exists, the visualization shows the longest partial linearization that ends with an illegal LP that is the event being hovered over. Hovering over an event also shows a tooltip showing extra information, such as the previous and current states of the state machine, as well as the time the operation was invoked and when it returned. This information is derived from the currently selected linearization.
Clicking on a history element selects it, which highlights the event with a bold border. This has the effect of making the selection of a partial linearization "sticky", so it's possible to move around the history without de-selecting it. Clicking on another history element will select that one instead, and clicking on the background will deselect.
All that's needed to visualize histories is the
CheckOperationsVerbose /
CheckEventsVerbose functions, which return extra
information that's used by the visualization, and the Visualize
function, which produces the visualization. For the visualization to be good,
it's useful to fill out the DescribeOperation and DescribeState fields of
the model. See visualization_test.go for an
end-to-end example of how to visualize a history using Porcupine.
If Porcupine runs really slowly on your model/history, it may be inevitable, due to state space explosion. See this issue for a discussion of this challenge in the context of a particular model and history.
If you use Porcupine in any way in academic work, please cite the following:
@misc{athalye2017porcupine,
  author = {Anish Athalye},
  title = {Porcupine: A fast linearizability checker in {Go}},
  year = {2017},
  howpublished = {\url{https://github.com/anishathalye/porcupine}}
}Copyright (c) Anish Athalye. Released under the MIT License. See LICENSE.md for details.