Go 1.7 observed performance changes (production canary@eeca3ba)
4,136 views
Skip to first unread message

Brian Hatfield
May 6, 2016, 8:48:13 AM5/6/16
to golan...@googlegroups.com
Hi Friends,
Thanks for all your hard work on 1.7 so far. A couple of days ago, Damian Gryski tweeted a request for folks to canary 1.7 sooner rather than later, so I thought I would share some graphs from one of our highest request-rate production services. These images are from https://github.com/golang/go/commit/eeca3ba92fdb07e44abf3e2bebfcede03e1eae12 which was current master at the time I built.
In each image, the blue line represents the canary host:

For a little extra context, this is the same service referenced in previously shared GC performance improvements:
https://twitter.com/brianhatfield/status/634166123605331968
https://twitter.com/brianhatfield/status/692778741567721473
https://twitter.com/brianhatfield/status/634166123605331968
https://twitter.com/brianhatfield/status/692778741567721473
The overall system load does not appear to have meaningfully changed as a result of the observed performance improvements, which is a little surprising - I expected an observable reduction in line with the GC and request performance improvements (about 5-10%?).
I'm happy to provide more information as requested.

Austin Clements
May 6, 2016, 5:54:26 PM5/6/16
to Brian Hatfield, golang-dev
Thanks for the performance updates! We really appreciate getting some visibility into the impact of our changes on other peoples' systems. End-to-end latency is particularly informative since it's not just the runtime measuring itself (which, while informative, can very easily be misleading).
A few questions and thoughts inline below.
On Fri, May 6, 2016 at 5:47 AM, Brian Hatfield <bmhat...@gmail.com> wrote:
Hi Friends,Thanks for all your hard work on 1.7 so far.
A couple of days ago, Damian Gryski tweeted a request for folks to canary 1.7 sooner rather than later, so I thought I would share some graphs from one of our highest request-rate production services. These images are from https://github.com/golang/go/commit/eeca3ba92fdb07e44abf3e2bebfcede03e1eae12 which was current master at the time I built.
In each image, the blue line represents the canary host:
Which release are the non-canaries running? I ask mainly because there was a bug fix in 1.6.2 (2644b76) that could significantly improve end-to-end latency in some situations (pre-1.6.2, if the stars aligned, the sweeper became effectively STW).
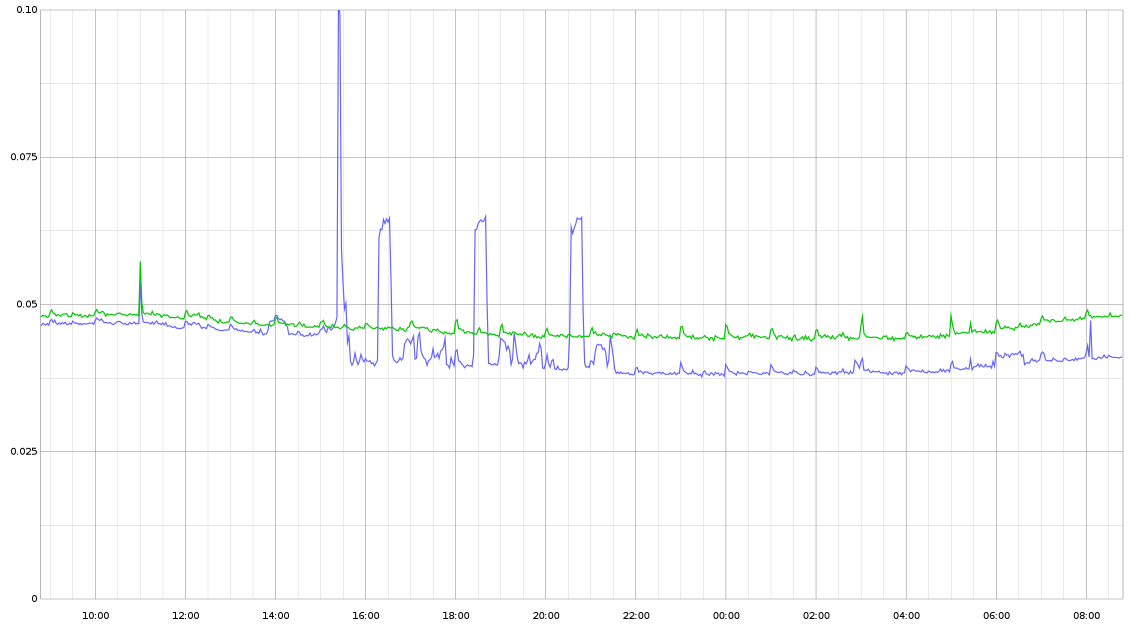
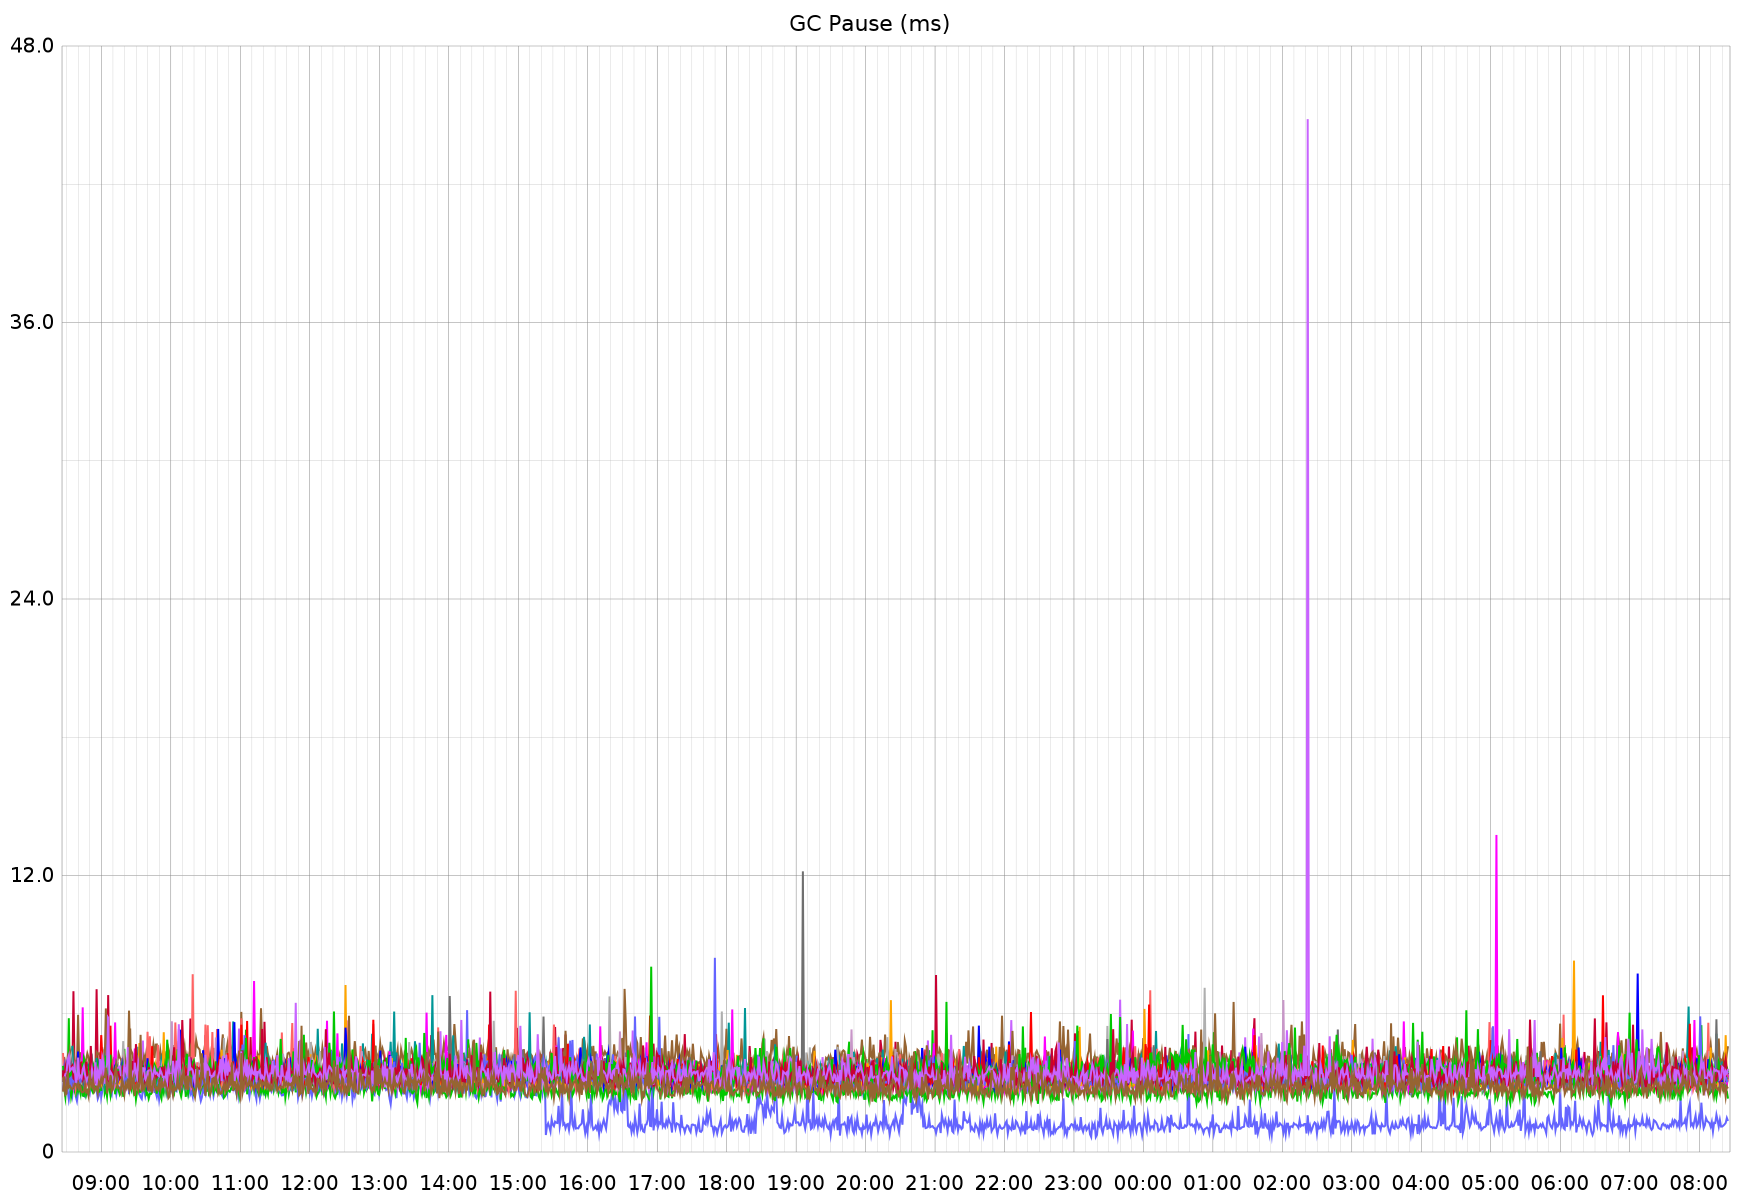
There didn't seem to be a notable change in the overall system memory profile of this service, so I am not sure what this change truly represents.Next up is GC pause time, which seems to be further improved from 3-4ms to 1-2ms for this service.I'm seeing the above performance difference on other endpoints as well. The 3 "buttes" between 16:00 and 22:00 are not related to the Go version change; the improved performance is.First up is the per-request p95 performance for the most-called endpoint in this service. This route is intended to be fast. The timing (y axis) is in ms, so what you see here represents about an 8% improvement, down to ~40µs response times:For a little extra context, this is the same service referenced in previously shared GC performance improvements:
https://twitter.com/brianhatfield/status/634166123605331968
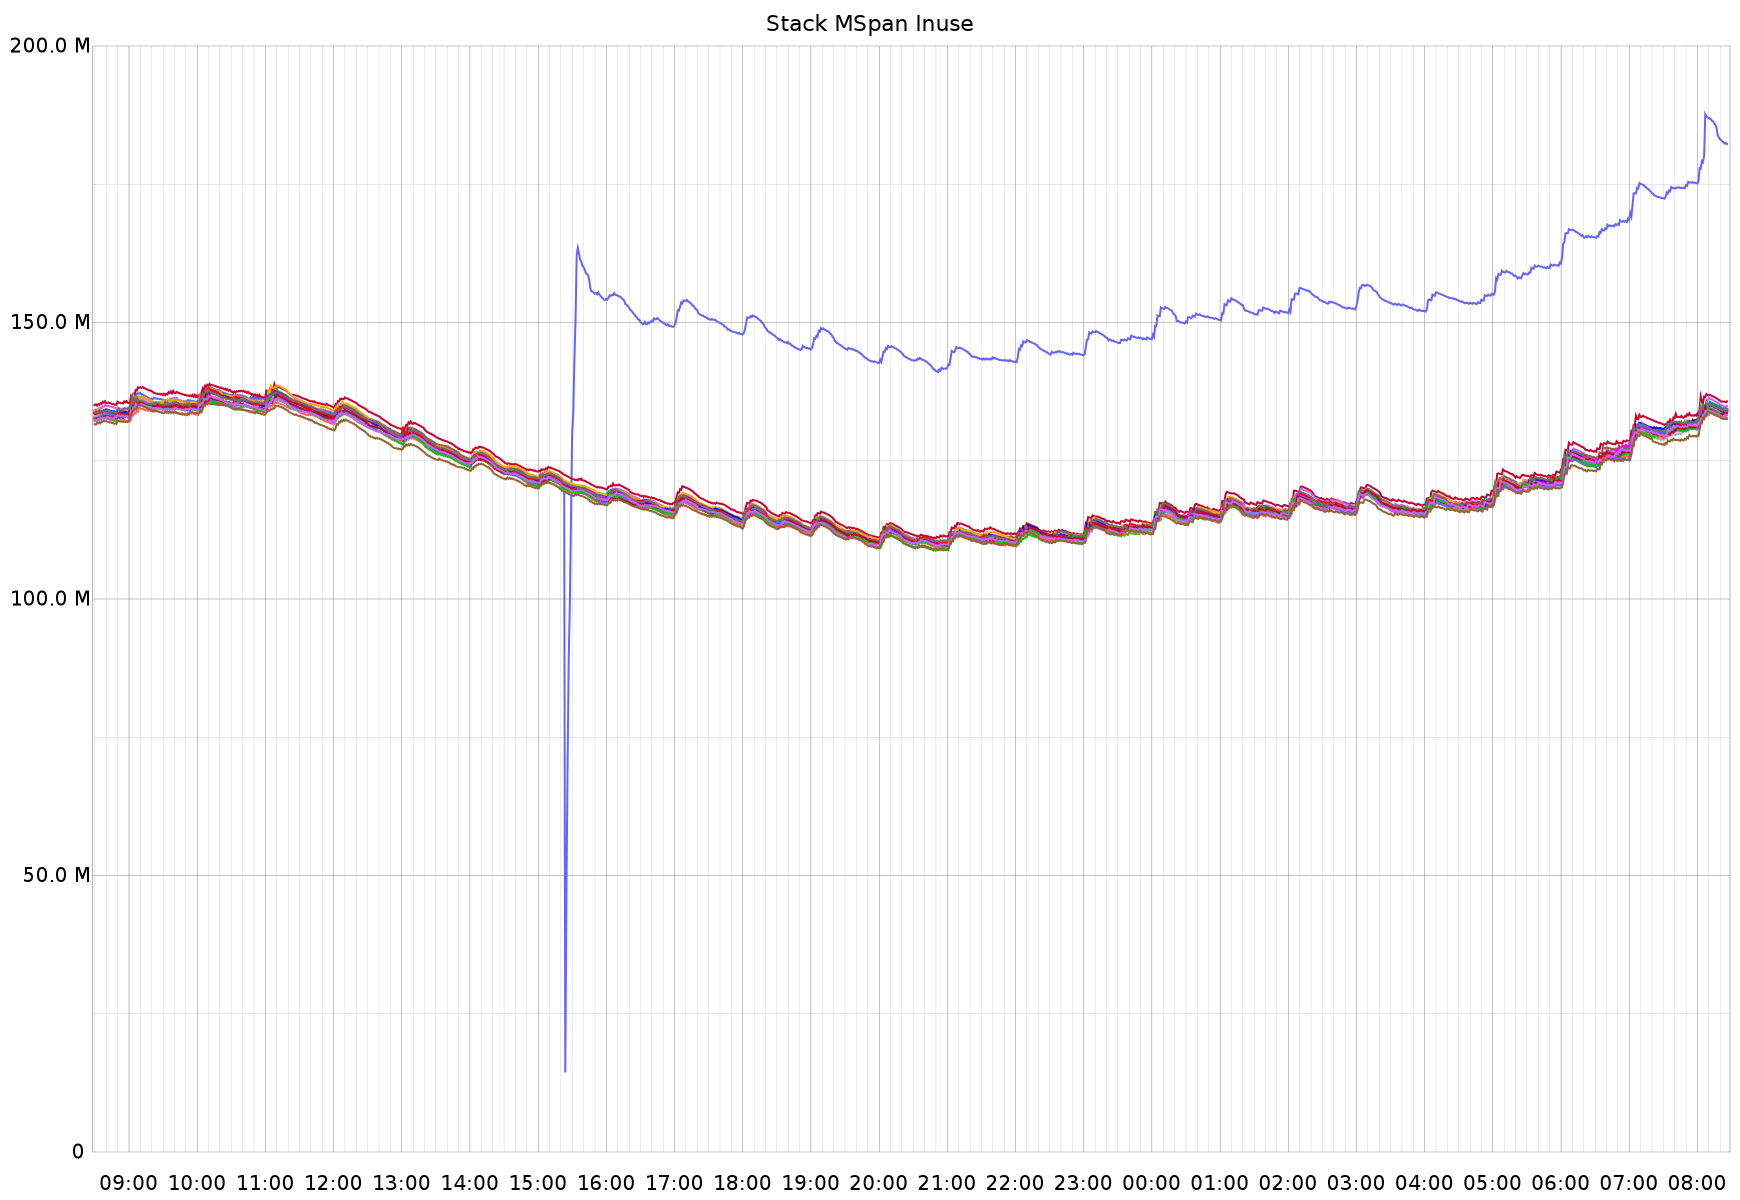
https://twitter.com/brianhatfield/status/692778741567721473Finally, the most changed metric is one I don't really understand, which is mspan_inuse:


In the text you said mspan_inuse, but the plot is labeled "stack MSpan inuse". Is this MemStats.StackInuse or MemStats.MSpanInuse? If this is StackInUse, it may just be that SSA produces very different stack layouts than the 1.6 compiler and may have produced a larger stack frame for some key functions. Since stacks are always power-of-two sized, if you're close to the stack boundary in some common code path used by lots of goroutines and the stack size of that path grows just enough to push it over the power of two boundary, it can have an outsized effect on overall stack allocation.
If the overall memory footprint didn't notably changed, this is probably nothing to worry about.
The overall system load does not appear to have meaningfully changed as a result of the observed performance improvements, which is a little surprising - I expected an observable reduction in line with the GC and request performance improvements (about 5-10%?).
Can you say more about how you're measuring system load?
Brian HatfieldThanks again for all your work,As far as compile times, they were already and continue to be excellent for our use cases, so I will leave benchmarking that up to Dave Cheney :-)I'll track for bugs or other issues and report them on Github as observed.
I'm happy to provide more information as requested.
--
You received this message because you are subscribed to the Google Groups "golang-dev" group.
To unsubscribe from this group and stop receiving emails from it, send an email to golang-dev+...@googlegroups.com.
For more options, visit https://groups.google.com/d/optout.
Brian Hatfield
May 6, 2016, 7:37:56 PM5/6/16
to Austin Clements, golang-dev
Hi Austin,
Thanks for your responses. Responses inline.On Fri, May 6, 2016 at 5:54 PM, Austin Clements <aus...@google.com> wrote:
Thanks for the performance updates! We really appreciate getting some visibility into the impact of our changes on other peoples' systems. End-to-end latency is particularly informative since it's not just the runtime measuring itself (which, while informative, can very easily be misleading).A few questions and thoughts inline below.On Fri, May 6, 2016 at 5:47 AM, Brian Hatfield <bmhat...@gmail.com> wrote:Hi Friends,Thanks for all your hard work on 1.7 so far.
A couple of days ago, Damian Gryski tweeted a request for folks to canary 1.7 sooner rather than later, so I thought I would share some graphs from one of our highest request-rate production services. These images are from https://github.com/golang/go/commit/eeca3ba92fdb07e44abf3e2bebfcede03e1eae12 which was current master at the time I built.
In each image, the blue line represents the canary host:Which release are the non-canaries running? I ask mainly because there was a bug fix in 1.6.2 (2644b76) that could significantly improve end-to-end latency in some situations (pre-1.6.2, if the stars aligned, the sweeper became effectively STW).
Oh no! The non-canary hosts are running 1.6. Some of this might be misattributed to 1.7 when it's really improved since 1.6.2. I didn't notice that there were expected performance differences in 1.6.2, and hadn't gone through the upgrade cycle yet for this endpoint - I can do so next week if that would be helpful. Apologies!
There didn't seem to be a notable change in the overall system memory profile of this service, so I am not sure what this change truly represents.Next up is GC pause time, which seems to be further improved from 3-4ms to 1-2ms for this service.I'm seeing the above performance difference on other endpoints as well. The 3 "buttes" between 16:00 and 22:00 are not related to the Go version change; the improved performance is.First up is the per-request p95 performance for the most-called endpoint in this service. This route is intended to be fast. The timing (y axis) is in ms, so what you see here represents about an 8% improvement, down to ~40µs response times:For a little extra context, this is the same service referenced in previously shared GC performance improvements:
https://twitter.com/brianhatfield/status/634166123605331968
https://twitter.com/brianhatfield/status/692778741567721473Finally, the most changed metric is one I don't really understand, which is mspan_inuse:In the text you said mspan_inuse, but the plot is labeled "stack MSpan inuse". Is this MemStats.StackInuse or MemStats.MSpanInuse? If this is StackInUse, it may just be that SSA produces very different stack layouts than the 1.6 compiler and may have produced a larger stack frame for some key functions. Since stacks are always power-of-two sized, if you're close to the stack boundary in some common code path used by lots of goroutines and the stack size of that path grows just enough to push it over the power of two boundary, it can have an outsized effect on overall stack allocation.If the overall memory footprint didn't notably changed, this is probably nothing to worry about.


This metric is MemStats.MSanInuse, as published by https://github.com/bmhatfield/go-runtime-metrics/blob/master/collector/collector.go#L137 - It looks like there may be a bug in my little "Go to statsd" metric exporter library where I've grouped these under 'stack' when they shouldn't be - is that correct?
The overall system load does not appear to have meaningfully changed as a result of the observed performance improvements, which is a little surprising - I expected an observable reduction in line with the GC and request performance improvements (about 5-10%?).Can you say more about how you're measuring system load?
5 minute Linux load average, as compared with a non-canary host performing the same workload.

die...@raintank.io
May 17, 2016, 3:44:20 PM5/17/16
to golang-dev
On Friday, May 6, 2016 at 2:48:13 PM UTC+2, Brian Hatfield wrote:
I expected an observable reduction in line with the GC and request performance improvements (about 5-10%?).
Hey Brian,
keep in mind that the STW pause time says little about how much cpu time is consumed by GC (or how much system load is generated by it).
In my experience, most of the GC workload is during the concurrent phases (i have some cpu intense concurrent phases that easily take multiple seconds while STW pause is only a few ms, which led me to contribute vis of timings of all phases to gcvis see https://github.com/davecheney/gcvis/pull/26). And I also remember that for the big GC change of 1.5 lower STW pause time was obtained by trading in a small cpu overhead for example.
Brian Hatfield
Aug 22, 2016, 9:37:45 PM8/22/16
to die...@raintank.io, golang-dev
Thank you all for your feedback back in May on my earlier (somewhat erroneous) metrics. Here's a tweet with some updated observations running a 1.7 canary in production (vs 1.6.3): https://twitter.com/brianhatfield/status/767890817587539968
Taking a moment to reflect on the huge gulf in the last year between the 300ms GC pause times in 1.4 and the now 1.5ms GC pause times in 1.7, this truly is phenomenal.--
You received this message because you are subscribed to the Google Groups "golang-dev" group.
To unsubscribe from this group and stop receiving emails from it, send an email to golang-dev+unsubscribe@googlegroups.com.
Reply all
Reply to author
Forward
0 new messages