Detectify is driving the future of internet security with appsec solutions powered by automation and crowdsourcing of web vulnerabilities. Detectify is a cloud-native security solution built upon microservices and here comes a blog post from the tech team’s adventures.
The developer team at Detectify has been working with Go for some years now, and it’s the language chosen by us to power our microservices. We think Go is a fantastic language and it has proven to perform very well for our operations. It comes with a great tool-set, such as the tool we’ll touch on later on called pprof.
However, even though Go performs very well, we noticed one of our microservices had a behavior very similar to that of a memory leak.
In this post we will go step-by-step through our investigation of this problem, the thought process behind our decisions and the details needed to understand and fix the problem.
How it began
We could see on our monitoring systems that memory usage for that microservice would slowly build up and never go down, until it reached a point where we suffered from OOM (Out of Memory) errors, or we needed to restart the service ourselves.
Even though Go has some excellent tools, at some points in this debugging journey we found ourselves wanting to investigate full core dumps, but as of the time this post was being written, that was not possible to do with pprof (or any other Go tool). It has its limitations but what it offers still helped us in the pursuit of the root cause of this memory issue.
Profiling Go with pprof
pprof is a Go tool used for visualization and analysis of profiling data. It works for both CPU and memory profiling, but here we won’t cover CPU profiling.
Setting up pprof in your web server is very simple. You can either call the pprof functions directly, like pprof.WriteHeapProfile, or you can setup the pprof endpoints and get the data from there, which we found more interesting.
For the second option, you only need to import the pprof package and it will register the endpoints at /debug/pprof. With this, you can extract the data just by sending a GET request to the endpoint, which is convenient for abstracting away the environment where you run your containers. According to the pprof docs, it’s safe to use it in production since there is very littleoverhead added by pprof. But remember that pprof endpoints should NOT be publicly accessible since they contain sensitive data about your services.
This is what you need to add to your code:
go
import (
"net/http"
_ "net/http/pprof"
)
And after this you should be able to access different pprof profiles at the /debug/pprof endpoint. If, for example, you want the heap profile, you would do:
curl https://myservice/debug/pprof/heap > heap.out
The tool has several built in profiles, such as:
– heap: A sampling of memory allocations of live objects in the heap.
– goroutine: Stack traces of all current goroutines.
– allocs: A sampling of all past memory allocations.
– threadcreate: Stack traces that led to the creation of new OS threads.
– block: Stack traces that led to blocking on synchronization primitives.
– mutex: Stack traces of holders of contended mutexes.
You can find more details about them in the pprof.go file.
We’ll spend most of our time looking at the heap profile. If you can’t find anything useful in the heap profile, try checking the others. We also checked the goroutine profile a few times to make sure we didn’t have any go routines hanging and leaking memory.
What are we looking for?
Before we dive in the debugging rabbit hole, it’s important to take a step back and try to have an idea what exactly we are looking for. In other words, in what ways can a memory leak (or other forms of memory pressure) appear in Go?
Go is a garbage collected language, which takes away a lot of memory management responsibility from developers, but we still need to be cautious to not block allocated memory from being garbage collected.
In Go, there are a few ways to do that and cause a memory leak. Most of the time they are caused by:
– Creating substrings and subslices.
– Wrong use of the defer statement.
– Unclosed HTTP response bodies (or unclosed resources in general).
– Orphaned hanging go routines.
– Global variables.
You can read more about these cases on go101, vividcortex and hackernoon.
Now we have an idea of what a memory leak looks like in Go, and at this point you might be tempted to say, “well, I don’t need a profiling tool anymore, I’ll just look at my code!”.
In reality, services have more than 10 lines of code and a couple of structs, so even though the examples you find are good to give you an idea of what a memory leak looks like, searching through your source code without any indicators beforehand might just be like searching for a needle in a haystack, and we recommend using pprof before jumping to the source code so you have a few good leads on where the problem might be.
The heap profile is always a good starter because the heap is where memory allocations happen. This is the memory that later gets garbage collected by Go. The heap is not the only place where memory allocations happen, some also happen in the stack, but we’ll not touch on the inner workings of a memory management system here, you can find more resources on that at the end of this post.
Searching for the leak
Having everything up and ready for debugging, we started by looking at the heap profile of our service.
curl https://services/domain-service/debug/pprof/heap > heap.out
Now we have the heap profile generated by pprof and we can start analysing it. Then run the following command to start a pprof interactive prompt.
go tool pprof heap.out
The prompt looks something like this:
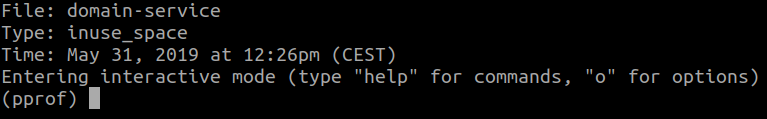
The part where it says Type: inuse_space indicates the profiling mode pprof
is using, which can be:
– inuse_space: Means pprof is showing the amount of memory allocated
and not yet released.
– inuse_objects: Means pprof is showing the amount of objects allocated
and not yet released.
– alloc_space: Means pprof is showing the amount of memory allocated,
regardless if it was released or not.
– alloc_objects: Means pprof is showing the amount of objects allocated,
regardless if they were released or not.
If you want to change the mode, you run:
go tool pprof - heap.out
Okay, but now getting back to the prompt, the most common command to run is top, which shows the top memory consumers. This is what we got:

Our first thoughts when we saw this was that something is off with either pprof or our monitoring systems, because we were seeing a 400MB memory consumption steadily, but pprof is reporting around 7MB. We logged in to our machines to check docker stats and they were reporting 400MB memory consumption as well.
What was going with pprof?
Here’s a brief explanation of what some of those terms mean:
– flat: Represents the memory allocated by a function and still held by that
function.
– cum: Represents the memory allocated by a function or any other function
that is called down the stack.
We also ran the png command on the pprof prompt to generate a graph of the calls and their memory consumption.

At this point it’s important to mention that pprof also supports a web UI. You can see all the data in your browser as well by running:
go tool pprof -http=:8080 heap.out
And by looking at the graph we decided to look at the code of the GetByAPEX function, since according to pprof there was a lot of memory pressure going on there (even though the maximum reported was 7MB). And indeed, we found a lot of code that would cause memory pressure if the amount of data was too large, such as using json.Unmarshal a lot, and appending structs to a slice a lot as well, which checks out with the graph generated by pprof. Briefly, what GetByAPEX does is fetch some data from our Elastic cluster, do some transformations, append them to a slice and return it.
Still though, this was not enough to cause a memory leak, it would only cause memory pressure, not to mention the 7MB reported by pprof was nothing compared to what we were seeing in our monitoring systems.
If you are running the web UI, you can go to the Source tab to check the source code annotated with memory consumption line by line. This is also possible in the terminal by using the pprof list command. It takes a regex as input and it will filter what source code to show you. So, for example, you can use list on the top consumers of memory returned by top.
We also decided to look at the amount of objects that were allocated. This is what we got:

After seeing this we thought that somehow the appending of structs to the slice was the culprit, but after analysing the code we concluded that there was no way that could be causing a memory leak since there was no code holding a reference to the slice or the inner array that makes up the slice.
At this point we were running out of ideas and thought maybe there was a memory leak in the library we use for Elastic in Go. Long story short, we didn’t find anything wrong there.
Could there be something wrong outside the scope of pprof?
We started thinking we should look at full core dumps or maybe there were hanging connections or go routines when making the requests to the Elastic cluster. So we looked at the goroutine profile of pprof:
curl https://services/domain-service/debug/pprof/goroutine > goroutine.out
go tool pprof goroutine.out

Everything looked normal as well, no unusual amount of Go routines were spawned. We also used netstat to check the amount of TCP connections that were being made to and from the service’s container, but there was nothing unusual either, all TCP connections were being terminated correctly. We saw a few idle connections but they were eventually terminated.
At this point we had to embrace the fact that this was not a memory leak. We had a lot of memory pressure being caused by that function and something was going on with either the Go garbage collector or its runtime that was hogging the memory. We decided that the best we could do was optimize the function to stream the data and not keep structs in memory, but at the same time we were intrigued by this weird behavior and we started researching about the Go memory management system.
We tried two things regarding the Go runtime: triggering garbage collection manually by using runtime.GC and calling FreeOSMemory from runtime/debug.
None of them worked, but we felt like we were getting closer to the main culprit because we found some issues open regarding the Go memory model and other people were also having problems with the runtime not releasing free memory to the operating system. FreeOSMemory was supposed to force this release but it wasn’t working for us.
We found out that Go is very attached to memory that it allocates, meaning that it holds on to it for a while before releasing the memory to the operating system. If your service has a peak in memory consumption and has at least 5 minutes of “calmness”, Go will start releasing memory to the operating system. Before that, it will hold on to it in case it needs that memory again to avoid the overhead of asking the operating system to reallocate more memory.
That sounds good and all, but even after 5 minutes the runtime was not releasing any memory at all. So we decided to do a little experiment to check if the problem really was with the Go runtime. We would restart our service and run a script that requests a lot of data for some time (let’s call this x amount of time), then after seeing a peak in memory consumption we would let it run for 5 more seconds and then stop. We would then run the script again for x amount of time (without the 5 seconds leeway) to check if Go would request more memory or if it would use just the amount it was holding on to. This is what we got:

Indeed, Go was not asking the operating system for more memory, it was using what it had reserved. The problem was that the 5 minute rule was not being respected and the runtime was never releasing memory to the operating system.
Now we were finally absolute sure it was not a memory leak after all, but it was still a bad behavior since we were “wasting” a lot of memory.
We found the culprit but we were still frustrated about this since it felt like it was something we couldn’t fix, it’s just how the Go runtime operates. Our first thought was to stop here and optimize the service, but we continued to dig deeper and found some issues on the Go repository talking about changes in the Go memory management system:
runtime: mechanism for monitoring heap size
runtime: scavenging doesn’t reduce reported RSS on darwin, may lead to OOMs on iOS
runtime: provide way to disable MADV_FREE
runtime: Go routine and writer memory not being released
It turns out that there was a change in Go 1.12 regarding how the runtime signals the operating system that it can take unused memory. Before Go 1.12, the runtime sends a MADV_DONTNEED signal on unused memory and the operating system immediately reclaims the unused memory pages. Starting with Go 1.12, the signal was changed to MADV_FREE, which tells the operating system that it can reclaim some unused memory pages if it needs to, meaning it doesn’t always do that unless the system is under memory pressure from different processes.
Unless you have other services that are running and are also memory-hungry, the RSS (Resident Set Size), which is basically the apparent amount of memory that the service is consuming, will not drop.
According to the issues on the Go repository, this is apparently a problem only on iOS, not on Linux, and yet we were experiencing the same problem. We then found out that we could run our Go service with this flag GODEBUG=madvdontneed=1 to force the runtime to use the MADV_DONTNEED signal instead of MADV_FREE. We decided to give this a try!
First we added a new endpoint at /freememory that would just call FreeOSMemory. This way we could check if it actually worked with the new signal. This is what we got:
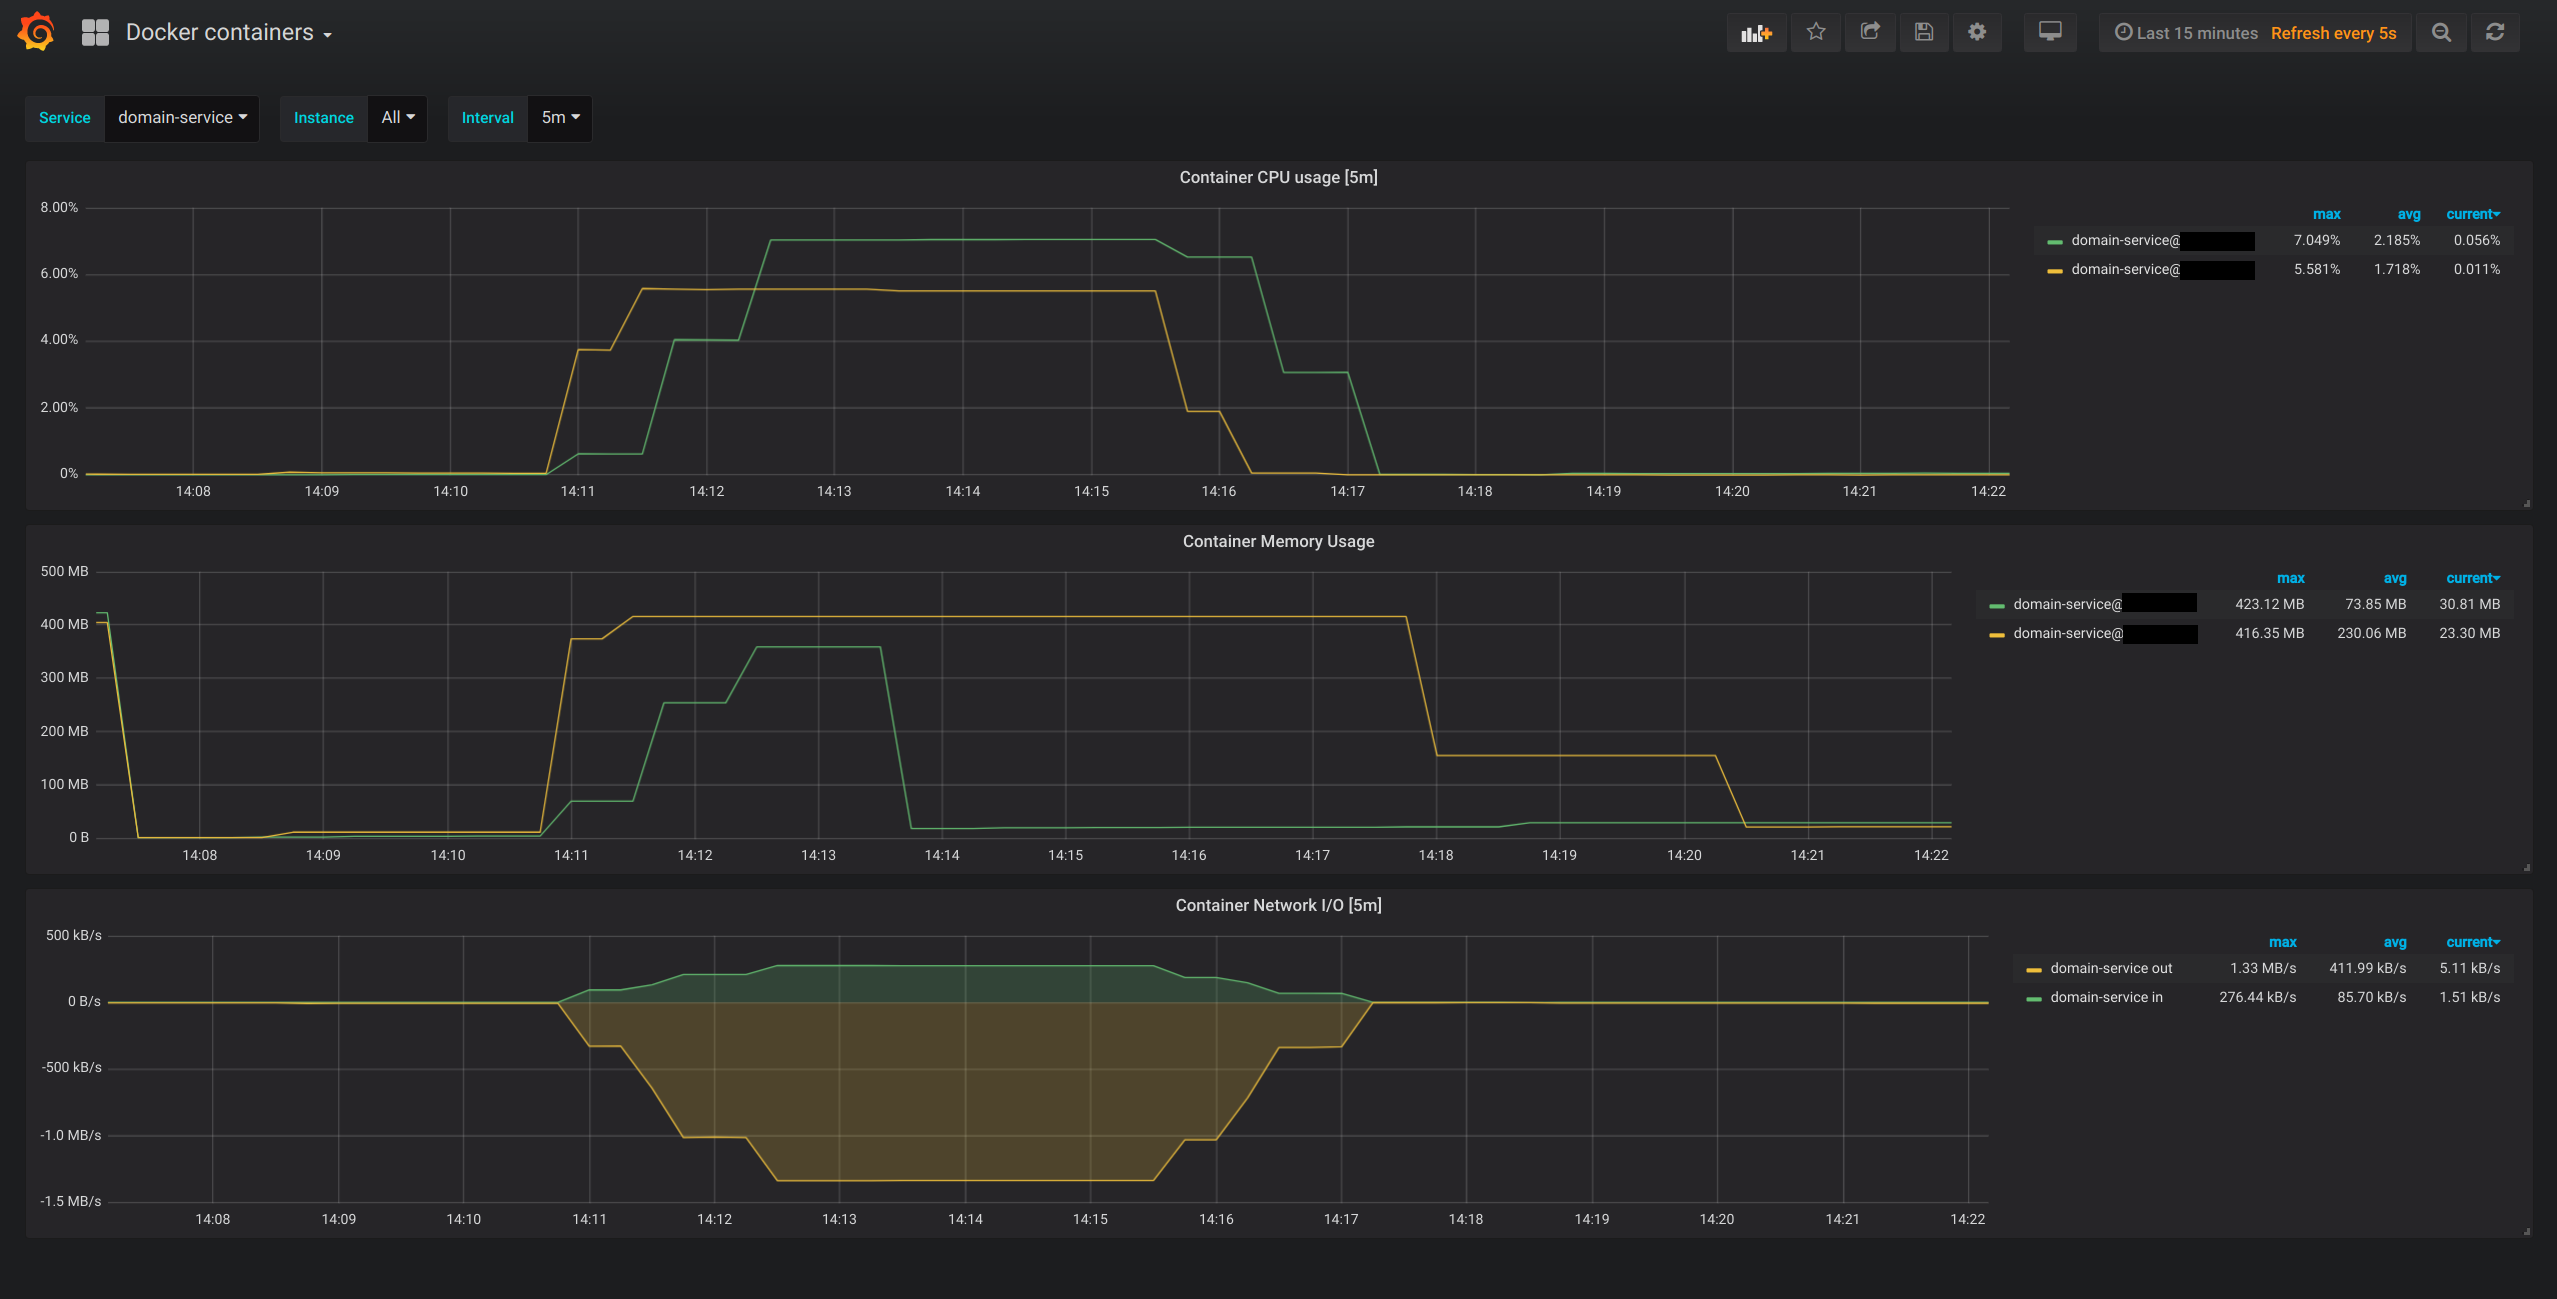
The green line (services-a) was the one we called /freememory between 14:13 and 14:14, and as you can see it actually released almost everything to the operating system. We didn’t call /freememory on services-b (yellow line), but apparently the 5 minutes rule was respected and the runtime eventually released the unused memory!
Conclusion
Don’t be out of the loop on how the runtime of your programming language operates and the changes it goes through! Go is a great language with an amazing bunch of tools, like pprof (which was right all along and didn’t show any indications of memory leak). Learning how to use it and read its output was the most valuable skill we have learned from this “bug”, so definitely check it out!
All the links we found along the way:
Jonathan Levison on how he used pprof to debug a memory leak.
[VIDEO] Memory leaks in Go and how they look like.
Another memory leak debugging journey!
How to optimize your code if it’s suffering from memory pressure, and also general tips on how the Go memory model works.
How the Go garbage collector works.
Go’s behavior on not releasing memory to the operating system.
Detectify helps you manage appsec with your microservices:
Is your security posture keeping up with your microservices architecture? Continuous delivery also needs continuous security to keep up, and ensure that the apps you build and host stay resilient against external actors. Detectify delivers web application security using actual hacker payloads to help you detect exploitable vulnerabilities in the apps you build and host. Yes, this is more than a DAST.
Curious to see what Detectify will find in your apps? Start a free 2-week trial today.


