How to use Diago to diagnose CPU and memory usage in Go programs
Diago is a visualization tool for profiles and heap snapshots generated with pprof.
It is a stand-alone application displaying a call tree of the CPU usage per functions (or per line of codes in functions) but also capable of displaying heap snapshots.
We’ll see in this short article how to use Diago to get more insight in your Go programs and to help you debug them.
Run pprof in the Go program
If you know how to use pprof with Go binaries, this chapter won’t add
much to what you already know. If you don’t, you will see that it is quite
straight-forward.
There are a few ways of starting profiling using pprof, we will focus on the
easiest one: using its HTTP handler.
The Go standard library ships an HTTP handler exposing profiling samples, heap snashots,
goroutines information, traces and much more. In order to enable it, you have
to import net/http/pprof if you’re already using a HTTP server in your program:
import _ "net/http/pprof"
If you are not already serving HTTP in your program, the easiest way to get started is to import the packages as mentioned above and to add this snippet to your program:
  go func() {
	  log.Println(http.ListenAndServe("localhost:6060", nil))
  }()
With this done, pprof is exposing all the information on http://localhost:6060/debug/pprof.
Get profiles and heap snapshots
Now that pprof is exposing its data through HTTP, it’s quite easy to retrieve profiles and heap snashots.
Profile
A profile will contain information on the amount of time spent by the CPU in each function. It is a proportional value: pprof won’t observe exactly how long each function is running on the CPU, instead, pprof is frequently capturing samples of the CPU usage and they are later aggregated by the visualization tools.
Because the samples are frequently captured by pprof, you can decide how long you
want pprof to gather them. Let’s say we want to let pprof run for 30s, we will use
curl to download a 30s profile:
curl "http://localhost:6060/debug/pprof/profile?seconds=30" > profile
Heap snapshots
Pprof lets you capture a snapshot of the heap as well. Here’s the command to capture it:
curl "http://localhost:6060/debug/pprof/heap" > heap
We will see in the visualization chapter that there is two kind of information in this file: the total amount of memory allocated per functions since the start of the program and the amount of memory used by each function at the moment of capture.
Visualize the profile and the heap snapshot with Diago
First, if you want to compile and install Diago, use the command:
go get -u github.com/remeh/diago
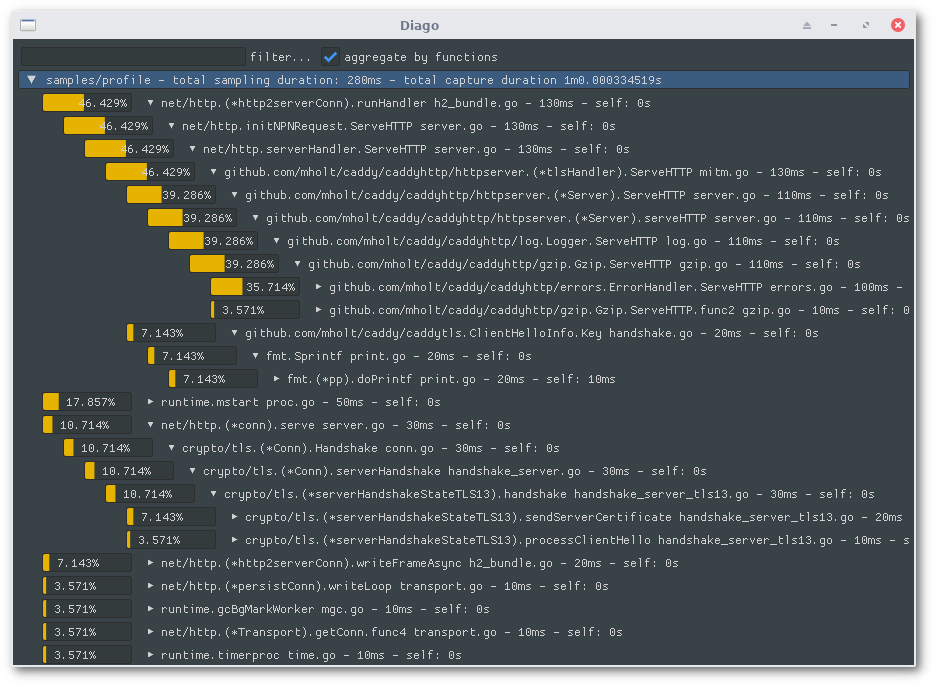
In order to visualize the profile, start Diago and use the -file flag to provide
the filepath of the file to open:
./diago -file profile
and here you go, you should have a visualization such as this one:
You can do the same to open the heap snapshot:
./diago -file heap
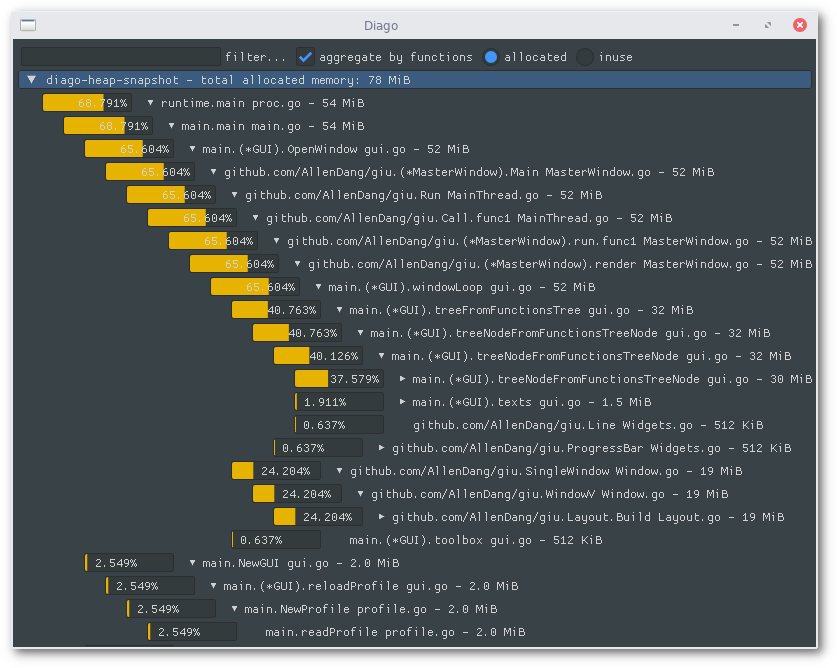
In the screenshot above, you can observe that we’re looking at the total memory allocated by each function of the program since it has started (the observed heap in this screenshot is actually a heap snapshot of Diago).
On the top right, you can see a switch to select the other mode displaying the memory usage at the moment of the capture.
Conclusion
There is other tools helping you visualize these files in flamegraph or in a dot diagram, you can even use the pprof command-line tool to display the data by top values and more.
I’ve developed this tool because I sometimes want to visualize this kind of information in a tree and I hope that it could be useful to you as well.
Don’t hesitate to ping me on Twitter or to check the source code available here.